Website analytics for small business: what to track and how to read it
Website analytics is the practice of collecting and reading data about the people who visit a website. It shows where visitors come from, what they do, and whether they take action.
Many small business owners build a website and never look at the numbers. This guide explains website traffic analysis in six steps. It covers the metrics that matter, how to read them, and a simple monthly review.
Key takeaways
- Website analytics shows who visits, where they come from, and what they do on the site.
- Start with a clear goal, such as inquiries or orders, before looking at any numbers.
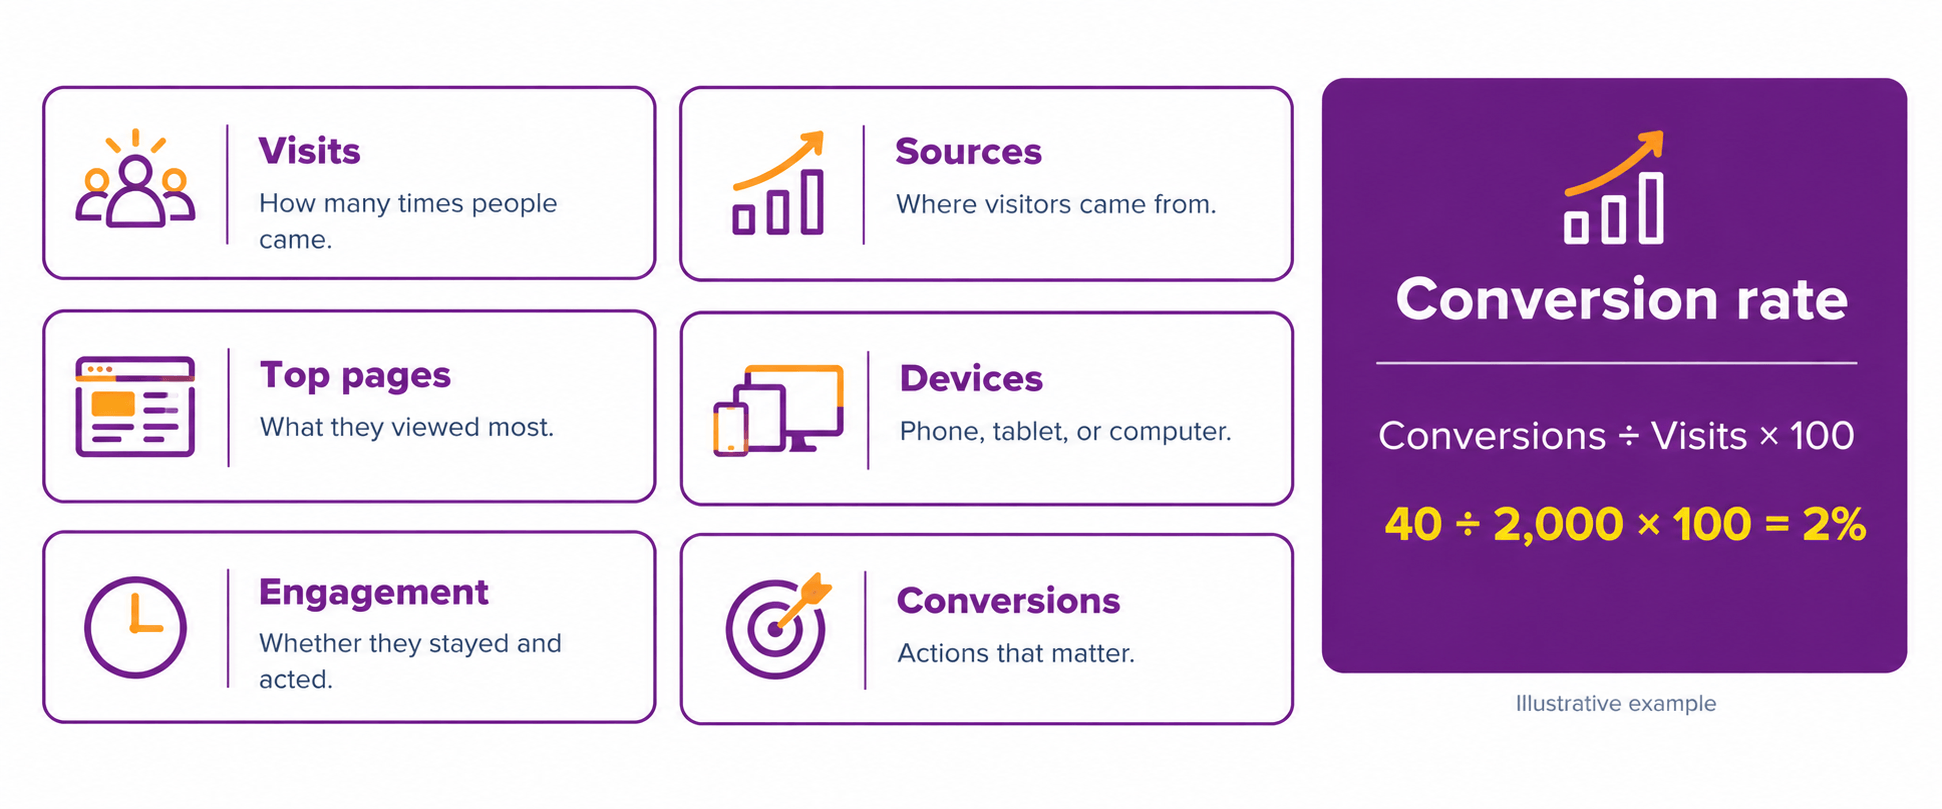
- A small set of metrics is enough: visits, sources, top pages, devices, and conversion rate.
- Patterns in the numbers point to problems, such as a confusing page or a weak call to action.
- A 30-minute monthly review beats occasional deep dives, and it works in any analytics tool.

What is website analytics?
Website analytics is the data a website records about its visitors. It includes how many people visit, which pages they view, and which actions they take. Analytics tools collect this data and present it in reports.
The data answers practical questions. Where do visitors come from? Which pages do they like? Where do they leave? Do they contact the business?
Analytics does not need to be complex. A small business can learn a great deal from a handful of simple reports.
Why does a small business need website analytics?
A website without analytics is like a shop without a footfall count. You may feel busy, but you cannot tell what works. As a result, you may spend money on the wrong things.
Analytics shows which channels bring real customers. It also shows which pages need work. In addition, it helps you judge whether changes to the site actually help.
Good data supports better choices. deAsra’s guide to content marketing strategy explains how to use these insights to plan content.
How to start website traffic analysis in six steps
Six steps take a business from no data to a useful routine. Work through them in order.
Step 1: Set clear goals. Decide what the website should achieve. Typical goals are inquiries, calls, bookings, or sales. Write down one or two goals. Every metric you track should link back to them.
Step 2: Install tracking and check it works. Add an analytics tool to the website, following its setup instructions. Then visit your own site and confirm that the visit appears in the reports. Many sites run for months with broken tracking.
Step 3: Define what counts as a conversion. A conversion is an action that matters to the business. Examples include a form submission, a call button click, a message click, or a purchase. Set these up as tracked events, so the tool counts them.
Step 4: Learn the main reports. Focus on a few reports: traffic sources, top pages, devices, and conversions. Ignore the rest at first. You can explore more once the basics feel familiar.
Step 5: Review on a fixed schedule. Set a monthly review and keep a record of the key numbers. Compare each month with the previous one, and with the same month last year if available.
Step 6: Act on one finding at a time. Pick one clear problem, make one change, and watch the results. Changing many things at once makes it hard to see what worked.
Which website metrics matter most?
Tools show dozens of numbers, but a few matter most. The table below lists the key metrics and what each one tells you.
| Metric | What it tells you | What to watch |
| Visits | How many times people came to the site | Steady growth over months |
| Traffic sources | Where visitors came from, such as search, social, or direct | Which source brings real inquiries |
| Top pages | Which pages visitors view most | Whether key pages get attention |
| Devices | Whether visitors use phones, tablets, or computers | A weak experience on the main device |
| Engagement or bounce rate | Whether visitors stay and interact | Pages where many visitors leave at once |
| Conversion rate | The share of visits that lead to an action | Changes after you edit a page |
Different tools use different names and definitions. Read the tool’s help page to see exactly how it counts each metric.
How to track website traffic by source
Traffic sources show how people found the website. Most tools group them into a few types.
- Search: visitors who came from a search engine.
- Direct: visitors who typed the address or used a saved link.
- Social: visitors who came from social media.
- Referral: visitors who came from a link on another website.
- Paid: visitors who came from ads.
- Email: visitors who clicked a link in an email.
Look at which sources bring conversions, not just visits. A smaller source that sends many inquiries may matter more than a larger one that sends none. deAsra’s guides to Google Ads for small business and social media audits show how to review those channels.
What is conversion rate?
Conversion rate is the share of visits that end in a chosen action. It is one of the most useful numbers for a small business.
Use this simple formula.
Conversion rate (%) = conversions ÷ visits × 100
Here is a worked example. The figures are illustrative only. Suppose a website had 2,000 visits in a month and 40 of them led to an inquiry. The conversion rate is 40 ÷ 2,000 × 100, which is 2%.
If a page improvement raised the rate to 3% on the same traffic, the site would earn 60 inquiries. That is 20 more inquiries without any extra visitors. This is why conversion matters as much as traffic. deAsra’s sales funnel guide explains how conversion fits into the wider journey.
What is bounce rate?
Bounce rate is a measure of visitors who leave without interacting further. In older reports, it meant a visit that viewed only one page. Some tools now report engagement instead, so the definition varies by tool.
A high bounce rate is not always bad. A visitor who finds a phone number and calls has done what you wanted. Therefore, always read bounce rate together with conversions and the type of page.
Use it as a clue. A high rate on a page that should lead to action, such as a service page, suggests that the page needs work.
What do the numbers suggest?
Patterns in the data point to likely causes. The table below shows common patterns and sensible next steps. These are possibilities to investigate, not certain answers.
| Pattern | Possible cause | What to try |
| Many visits, few conversions | Unclear offer or weak call to action | Make the offer and next step clearer |
| High exits on phones | Slow loading or poor mobile layout | Test the site on a phone and simplify it |
| Visitors view a contact page but do not submit | A long or broken form | Shorten the form and test it |
| All traffic from one source | Heavy dependence on a single channel | Test one more channel |
| Popular page with no links to services | Missed chance to guide visitors | Add a clear next step on that page |
| Traffic falls suddenly | A change to the site, season, or search changes | Check recent edits and compare with last year |
Always change one thing at a time, then watch the numbers for a few weeks.
How to run a 30-minute monthly review
A short routine keeps analytics useful. Follow these steps each month.
- Open the traffic report and note visits compared with last month.
- Check traffic sources and note which bring conversions.
- Review the top five pages and look for any that underperform.
- Check the device split and test the site on the main device.
- Calculate the conversion rate and compare it with last month.
- Choose one change to test next month, and write it down.
Keep the numbers in a simple sheet. Over a few months, the trends become clear.
What should a business know about privacy?
Collecting visitor data comes with responsibilities. As of 2026, rules on cookies, consent, and data protection differ by country and can change. Tell visitors what you collect, and avoid collecting personal data you do not need.
This guide offers general information only. Check the current rules that apply to your business, or ask a qualified adviser, before you set up tracking.
What mistakes should a small business avoid?
A few common mistakes reduce the value of analytics.
- Tracking everything and acting on nothing.
- Never checking that tracking works.
- Judging success by visits alone.
- Ignoring mobile visitors.
- Changing many things at once.
- Skipping the monthly review.
Conclusion
Website analytics turns guesses into decisions. It shows where visitors come from, what they do, and whether they act.
The process is simple. Set clear goals, install and check tracking, and define conversions. Then learn the main reports, review monthly, and test one change at a time.
Start this week by writing down the one action you want visitors to take. Then check that your tracking counts it correctly.
Your next step

Frequently asked questions
What is website analytics?
It is the data a website records about its visitors, including how many come, where they come from, and what they do. Tools present this data in reports.
How to track website traffic for a small business?
Add an analytics tool to the site and confirm that it records your own visit. Set up conversions, such as form submissions or call clicks, and review the reports every month.
Which website metrics should a small business track?
Start with visits, traffic sources, top pages, device split, and conversion rate. Add others only when you need them.
What is a good conversion rate?
It depends on the business, the page, and the traffic source, so no single number fits everyone. Compare your own rate over time and test changes to improve it.
What does bounce rate mean?
It measures visitors who leave without interacting further. Definitions differ by tool, so read the help page of your tool and view the rate together with conversions.