Taluka view, ODOP and other insights: what is new on our Maharashtra Udyam dashboard
The dashboard now goes down to the taluka, follows each district’s official ODOP products, and publishes its monthly series for download.
When we introduced the Udyam district dashboard in September, we discussed five questions about Maharashtra’s districts that the dashboard can help answer: what the district does, what is changing, how concentrated it is, how any industry compares across districts, and where within the district activity sits. The latest update, now live at insights.deasra.in, holds 6,813,431 Udyam registrations to 12 October 2026, and it goes further in three directions: down, to the taluka; across, to the products each district has been asked to champion; and through time, month by month. The last one is important for users who want to use Udyam registration as an indicator of formalisation at district level, because they can now download a monthly time series of Udyam registrations for each district of Maharashtra, as available on data.gov.in.
This post introduces these updates with some illustrative discussion. We would like to know if this dashboard is useful and what improvements we can make.
What has been added
- Taluka by Taluka. Every district is further divided into its talukas: 357 of Maharashtra’s 360 hold registered enterprises, and 96.7% of all registrations can be mapped to a taluka. For each taluka, the page shows its size, its largest sector, its manufacturing share and its growth beside the district’s, with a map. Most of the remainder (2.9% of registrations) carry a pincode belonging to a neighbouring district: they count towards the district’s totals but cannot be placed in one of its talukas. Only 0.4% sit on one of the district’s own pincodes that could not be located reliably within a taluka boundary, because taluka placement works through each pincode’s geo-coordinates.
- ODOP & Clusters. Each district’s two products under the state’s One District One Product list, plus its food-processing product under PMFME. For each, how many enterprises make it, how specialised the district is compared with every other district, whether that is rising or falling year by year, which talukas hold it, and the 377 official cluster projects, common facility centres and parks marked on the map.
- Monthly Series. Every district’s registrations month by month since July 2020, overall, by broad sector, by NIC division, and split into firm-like and livelihood registration. Monthly or quarterly, downloadable as CSV for one district or all 35.
- One growth measure everywhere. Districts, sectors and talukas are compared the same way: everything registered by the end of the latest complete month against the same month a year earlier.
- About the Data. The counting rules, how we place pincodes in talukas, how the firm-like and livelihood tiers are defined, and how our count compares with the Ministry of MSME’s own dashboard (which updates daily and reports the overall total), all in one place. The data for our dashboard comes from data.gov.in. It is now downloaded one registration date at a time, and each day is checked against the count the source reports for it. The registration-level data on data.gov.in lags the Ministry’s dashboard in its total count, and our dashboard carries the same lag.
Example 1: see what a district average hides
Over the past year, every Maharashtra district’s stock of registrations grew by roughly a fifth: from 17% in Mumbai to 27% in Yavatmal. On district figures alone, Maharashtra looks like it is moving in step. Its talukas range from 16% to 75%. Nearly three-quarters of the variation in taluka growth (73%) lies inside districts rather than between them, and 23 talukas sit more than ten points away from their own district.
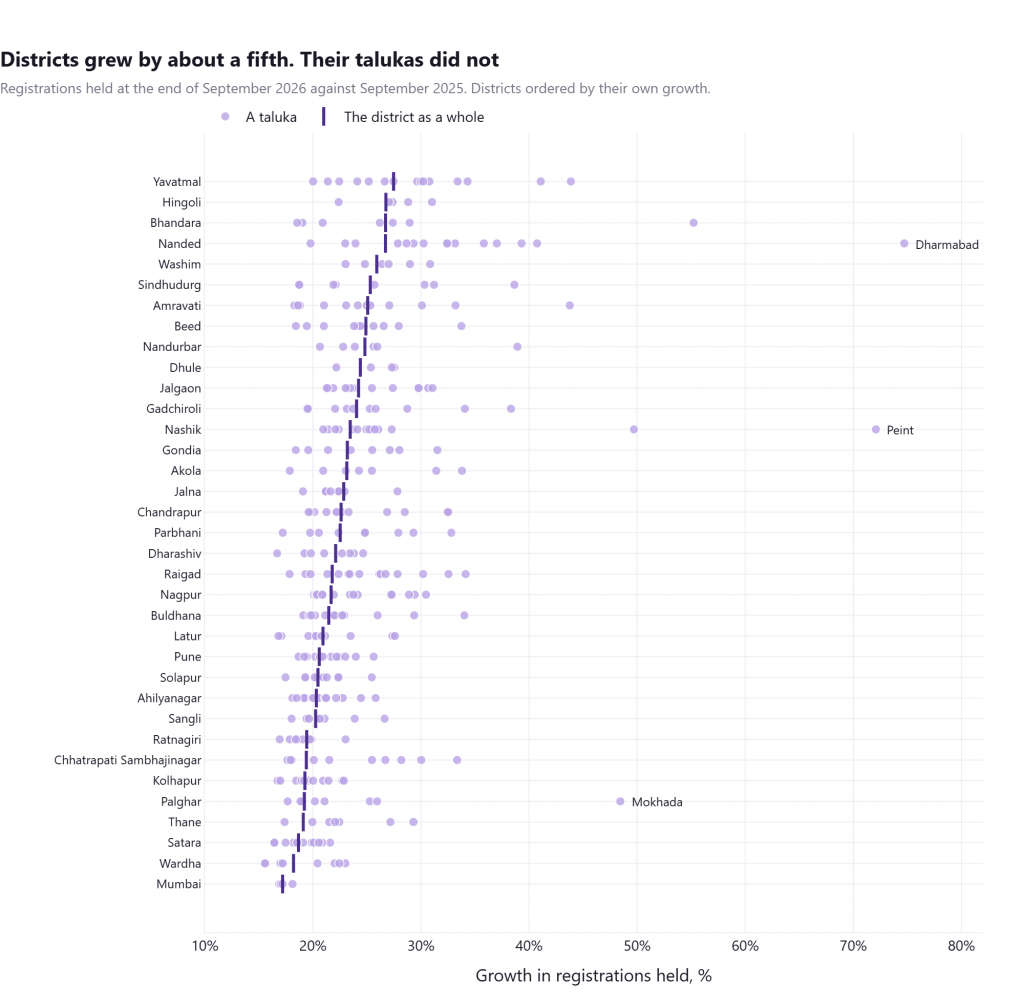
The outliers are worth a look. Peint, a tribal taluka in Nashik, grew 72% against Nashik’s 23%. Of the 860 enterprises it added in the year, 525 registered in a single month, June 2026. Dharmabad in Nanded (75%, against 27% for the district) took 817 registrations in July 2026. Mokhada in Palghar grew 48%. Spikes like these usually mean a registration camp or a scheme drive reached the block, or some quirk in how registrations were recorded; they certainly do not mean a sudden take-off of enterprise or of the local economy.
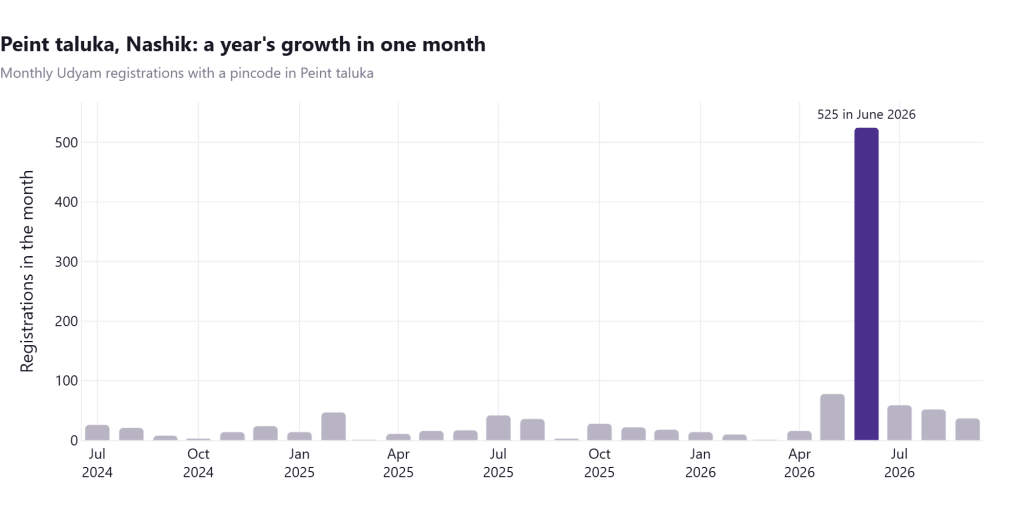
For a district industries centre, a lender or an organisation running outreach, that is useful in both directions. It shows where a drive landed and how large it was, and the talukas growing slowest show where the next one might be needed. A district figure shows neither.
The example also highlights what Udyam data can tell and what it cannot. Udyam growth, on its own, cannot tell us how the underlying economy is doing. Rapid or large registration activity, or both, often occurs in places that seem economically backward. It would be naïve, or manipulative, to take these patterns as cause for cheer. There are two ways one could look at Udyam data: for what it reveals about where formalisation has taken hold, and for what it cannot reveal without context. After the initial scramble to obtain Udyam registration, settled economic centres generally show slower growth in registrations. Figure 1 shows this clearly. Rapid growth reflects drives by government and civil society organisations, which are concentrated in places where formalisation is itself seen as an indicator or is linked to government-led support. So Udyam data, especially the pattern of recent growth, can be used to distinguish settled locations, locations where the ground has been prepared for interventions, and locations still waiting. At the same time, looking at Udyam numbers without the underlying context is like using the number of steps walked as an indicator of healthy living. Walked by a professional on a multi-million-rupee package, those steps might reflect healthy living, or a worrying recent diagnosis; for a rural woman, the drudgery of collecting firewood; for an urban domestic worker, the transaction costs of her work.
Example 2: what averages can and cannot tell us about a place
Ask anyone to name Maharashtra’s manufacturing districts and Pune comes first: Chakan, Pimpri-Chinchwad, Ranjangaon, the auto and engineering belt. Thane and Raigad, with Taloja, Patalganga and the chemical corridor, would follow. Interestingly, in the Udyam register, these are the three districts with the smallest manufacturing share in the state. Raigad is last at 20.5%, Pune 34th at 21.1%, Thane 33rd at 21.5%, against 24.7% for Maharashtra as a whole. Mumbai is 29th.
The top of the list is Bhandara (36.5%), Kolhapur (34.8%) and Sindhudurg (34.2%). Bhandara’s figure is lifted by a recent wave of tailors registering, which we wrote about in the first post. But even if we take wearing apparel out altogether, the order hardly changes: Kolhapur and Sindhudurg move to the top, and Pune is still 33rd.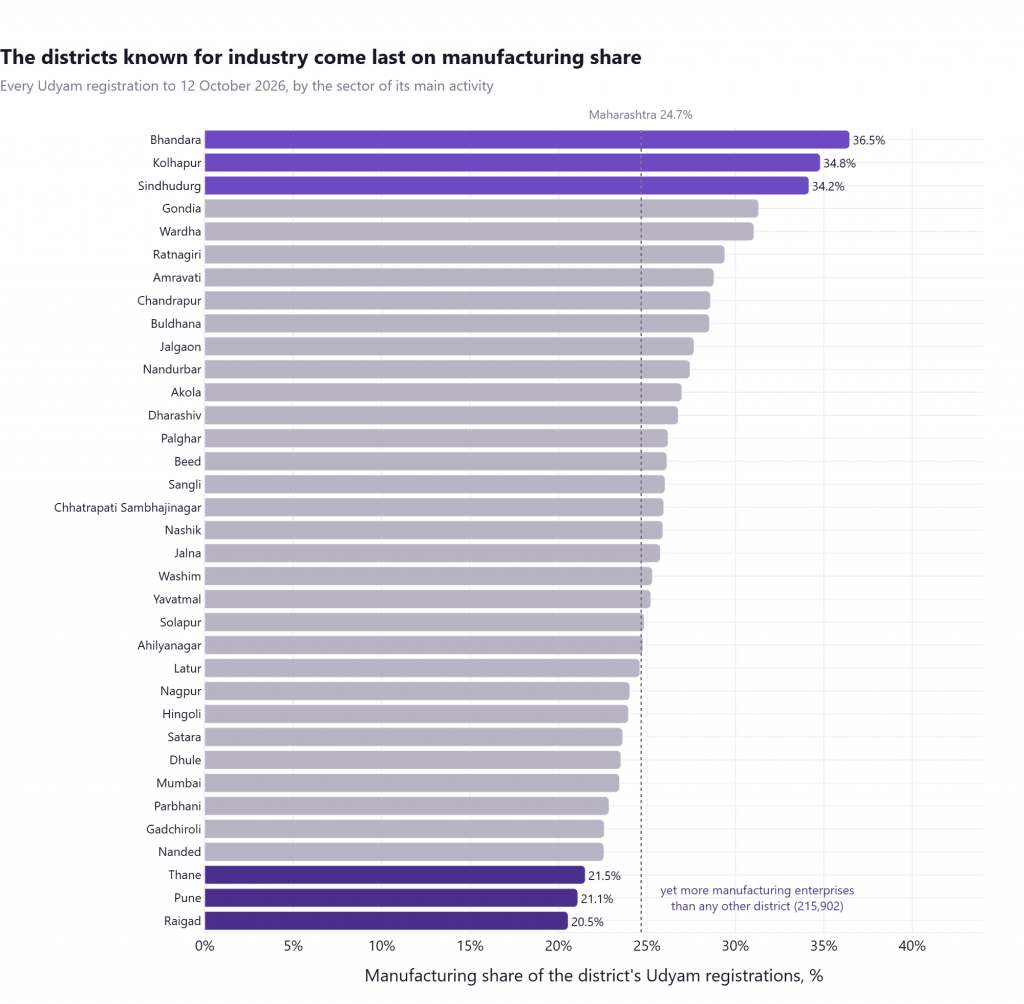
This is not because Pune has little manufacturing. It has more manufacturing enterprises than any other district: 215,902, about one in eight of the state’s. Mumbai (208,556) and Thane (148,662) come next. The industrial districts lead on the count and trail on the share.
Two things explain the pattern, and both are worth knowing before using the data.
Udyam counts enterprises, and every enterprise counts once. An auto-component plant with a thousand workers and a one-person tailoring unit are one registration each. A district’s industrial reputation rests on a relatively small number of large firms; its register is made up of everyone else. This also shows the limits of using formalisation as an indicator of the quality of activity. Formalisation has become more of a target and less of an indicator. There is a growing need to make the various formal footprints of businesses speak to each other, so that we can separate the animal instincts rather than treating the whole jungle as one.
Industry grows a services economy around it. In Pune, 53% of registrations are in services, against 47% statewide. Retail, eateries, wholesale, travel and transport operators, and personal services are its largest sectors. These are the businesses that feed, move and supply the workers and firms an industrial economy brings, aided, in Pune, by the presence of IT firms that are part of global information and financial flows.
What manufacturing Pune does have is distinctive in kind rather than in amount. Fabricated metal products are 10.6% of its manufacturing enterprises against 5.8% statewide, and machinery 6.6% against 3.8%. Its ODOP product, engineering goods, is genuinely specialised at 1.54× the state rate, 2nd in Maharashtra. Food processing and garments, the bulk of small-scale manufacturing elsewhere, are thinner here.
The taluka view shows the same pattern within districts. Khed, home to the Chakan industrial belt, has a manufacturing share of 24%, just below the state average, again showing the effect of Udyam counting every enterprise equally. Hatkanangale, which contains Ichalkaranji, has 45%. In Thane district, Ulhasnagar, a town of small workshops, has 37% against 18% in Thane taluka itself.
What we see is that sectors where a few large employers dominate are likely to hide under averages, because Udyam treats enterprises of every employment size alike. Udyam averages are good indicators of livelihood activity at district level, but not of large, scale-oriented businesses. You can reproduce this, and other insights, yourself on the dashboard.
Example 3: check an official product against the register
One District One Product names what each district should build on. The register can say how distinctive the district actually is in it. Often it agrees strongly. Gondia’s rice milling runs at 19.7× the state rate, Sindhudurg’s cashew processing at 12.4× and Ratnagiri’s marine produce at 11.1×, each the highest of any district.
Sometimes it does not. Textiles, Amravati’s primary ODOP product, run at 0.87× the state rate in Amravati’s registrations, 12th of 35 districts. Engineering in Nagpur is 0.74×, 15th. That is not a verdict on the choice. A product can be chosen for what a district intends to become, and Udyam counts enterprises, not output. But it is worth knowing which ODOP products build on an existing base of small firms and which would have to create one.
The taluka view adds where. 84% of Nashik’s silk weavers, the activity behind Paithani, are in Yevla, and 89% of Solapur’s cotton weavers and towel makers are in Solapur North. A district product is often a one-taluka product, and support placed at the district headquarters may sit some distance from it.
One limit to keep in mind: Udyam sees processing and trade, not farming. Products such as oranges, mangoes or pomegranates show up only through the enterprises that process or trade them, and the page says so.
Example 4: build your own indicator
Monthly Series is meant for people who want the numbers rather than the charts: every district, every month since July 2020, by sector, NIC division and tier, as a CSV. A researcher can set it beside credit, GST or employment data; a programme team can track registrations in the sectors and districts it works in without waiting for an annual report.
Tell us what to look at next
The dashboard is built for people who think about India’s districts, the level at which much administrative and civil society action takes place. It gets better when they tell us where it is wrong, what it does not yet answer, and what we can improve. Making it nationwide is obviously on our minds, and in time we will get there.
Write to us at insights@deasra.co.in.
Data note: figures are from the dashboard’s October 2026 refresh, covering Udyam registrations in Maharashtra from July 2020 to 12 October 2026. Growth compares registrations held at the end of September 2026 with September 2025; taluka growth is shown where a taluka held at least 50 registrations a year earlier, and the within-district share uses talukas with 500 or more. Manufacturing share is by the sector of each enterprise’s main activity. Source: Udyam registration data published by the Ministry of Micro, Small and Medium Enterprises on data.gov.in; ODOP list from the Directorate of Industries, Maharashtra.