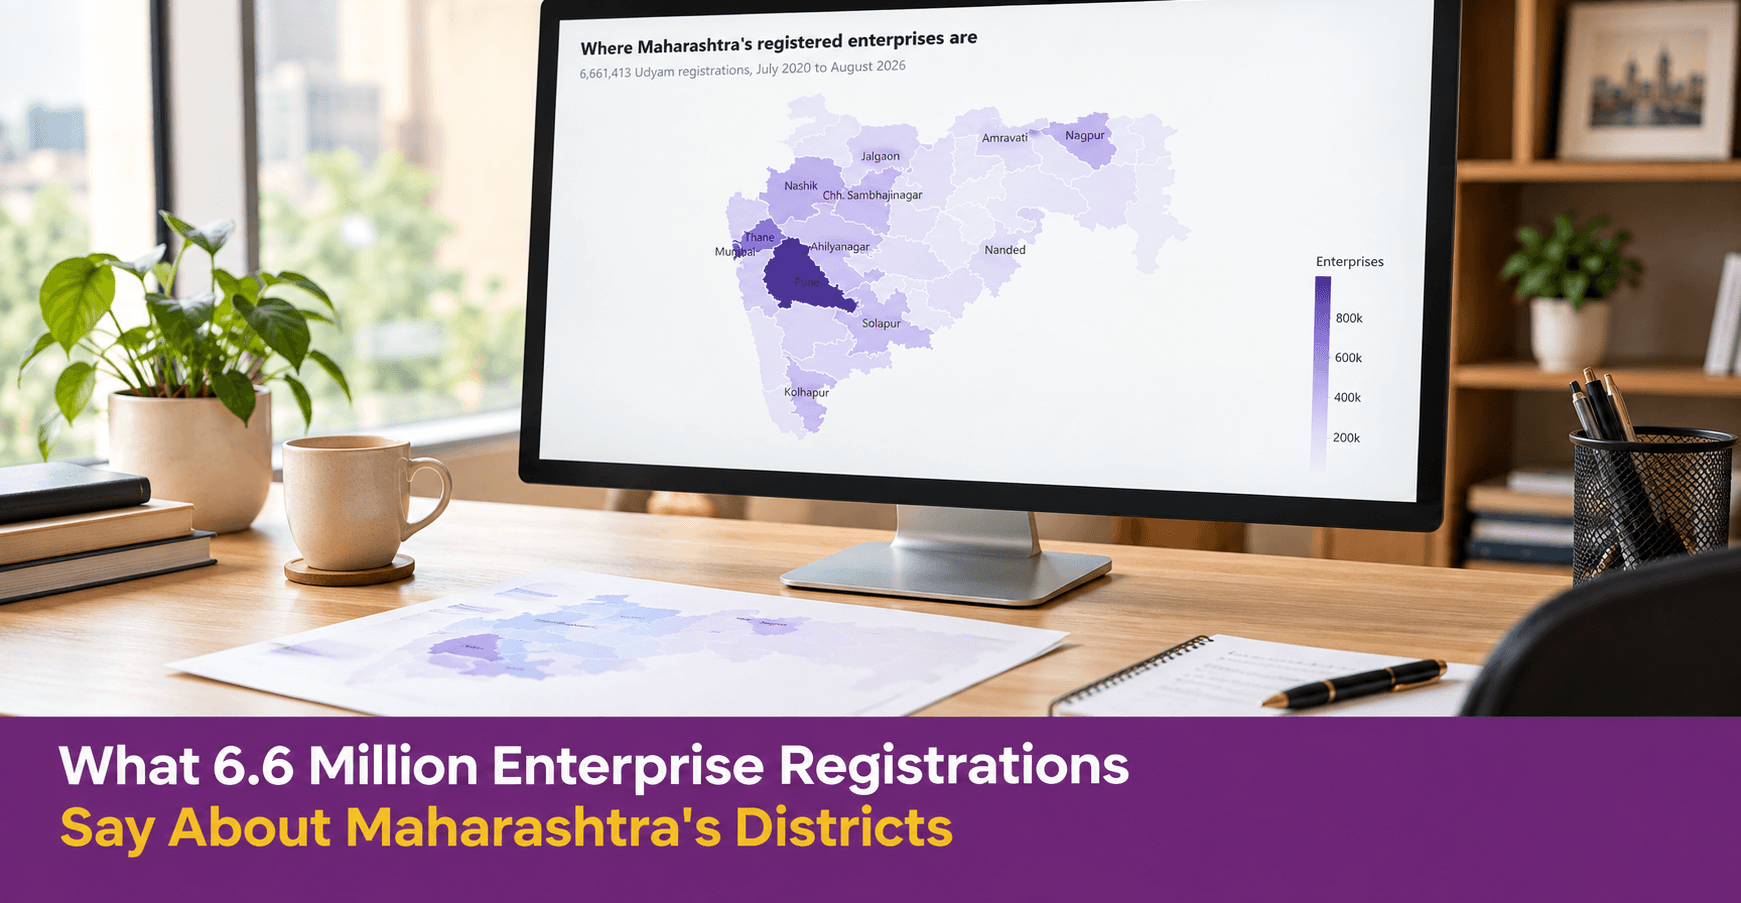
What 6.6 million enterprise registrations say about Maharashtra’s districts
Udyam registration has become synonymous with MSMEs. It is a cliched argument that MSMEs are critical part of economic growth, especially employment generation. The availability of Udyam registration microdata on daily basis, at as granular level as pincode, provides an opportunity to glean a meaningful perspective at the MSMEs.
Currently, we can see the name, date of registration, sectors of activity, and pincode for every Udyam registered enterprise. There is no information on turnover, employment generation, capital, credit, or classification within MSME.
The granularity allows microscopic as well as bird’s eye view. What is available allows us to use the Udyam registration data to learn some interesting and useful things about enterprises. To list few: we can learn about district level situation in terms of key activities, concentration or clustering especially clustering outside policy induced clusters like industrial zones, changing pace of registrations across sectors – reflecting waxing and waning of policies and allied efforts from civil society organizations. Udyam registrations is a voluntary choice, albeit incentivized, and thus it aligns with how individuals perceive their prospects and how these individual choices, seen collectively, tell us about emerging and prospective situation of the district or whatever spatial unit we choose to look at.
Ask a plain question about a district economy — what does Nanded make? is enterprise in Sindhudurg growing? where in Kolhapur does the textile trade actually sit? — and the data is thinner than you would expect. The Economic Census last went to the field in 2013. The Annual Survey of Industries covers registered factories. Most enterprise statistics stop at the state boundary.
Meanwhile, every business that registers under Udyam leaves a record: its district, its pincode, the date it registered, and what it does, coded to the National Industrial Classification. Since July 2020 Maharashtra has accumulated 6,661,413 of them, published free on data.gov.in. They are mostly used to count — so many lakh MSMEs registered this year — which is the least interesting thing you can do with them.
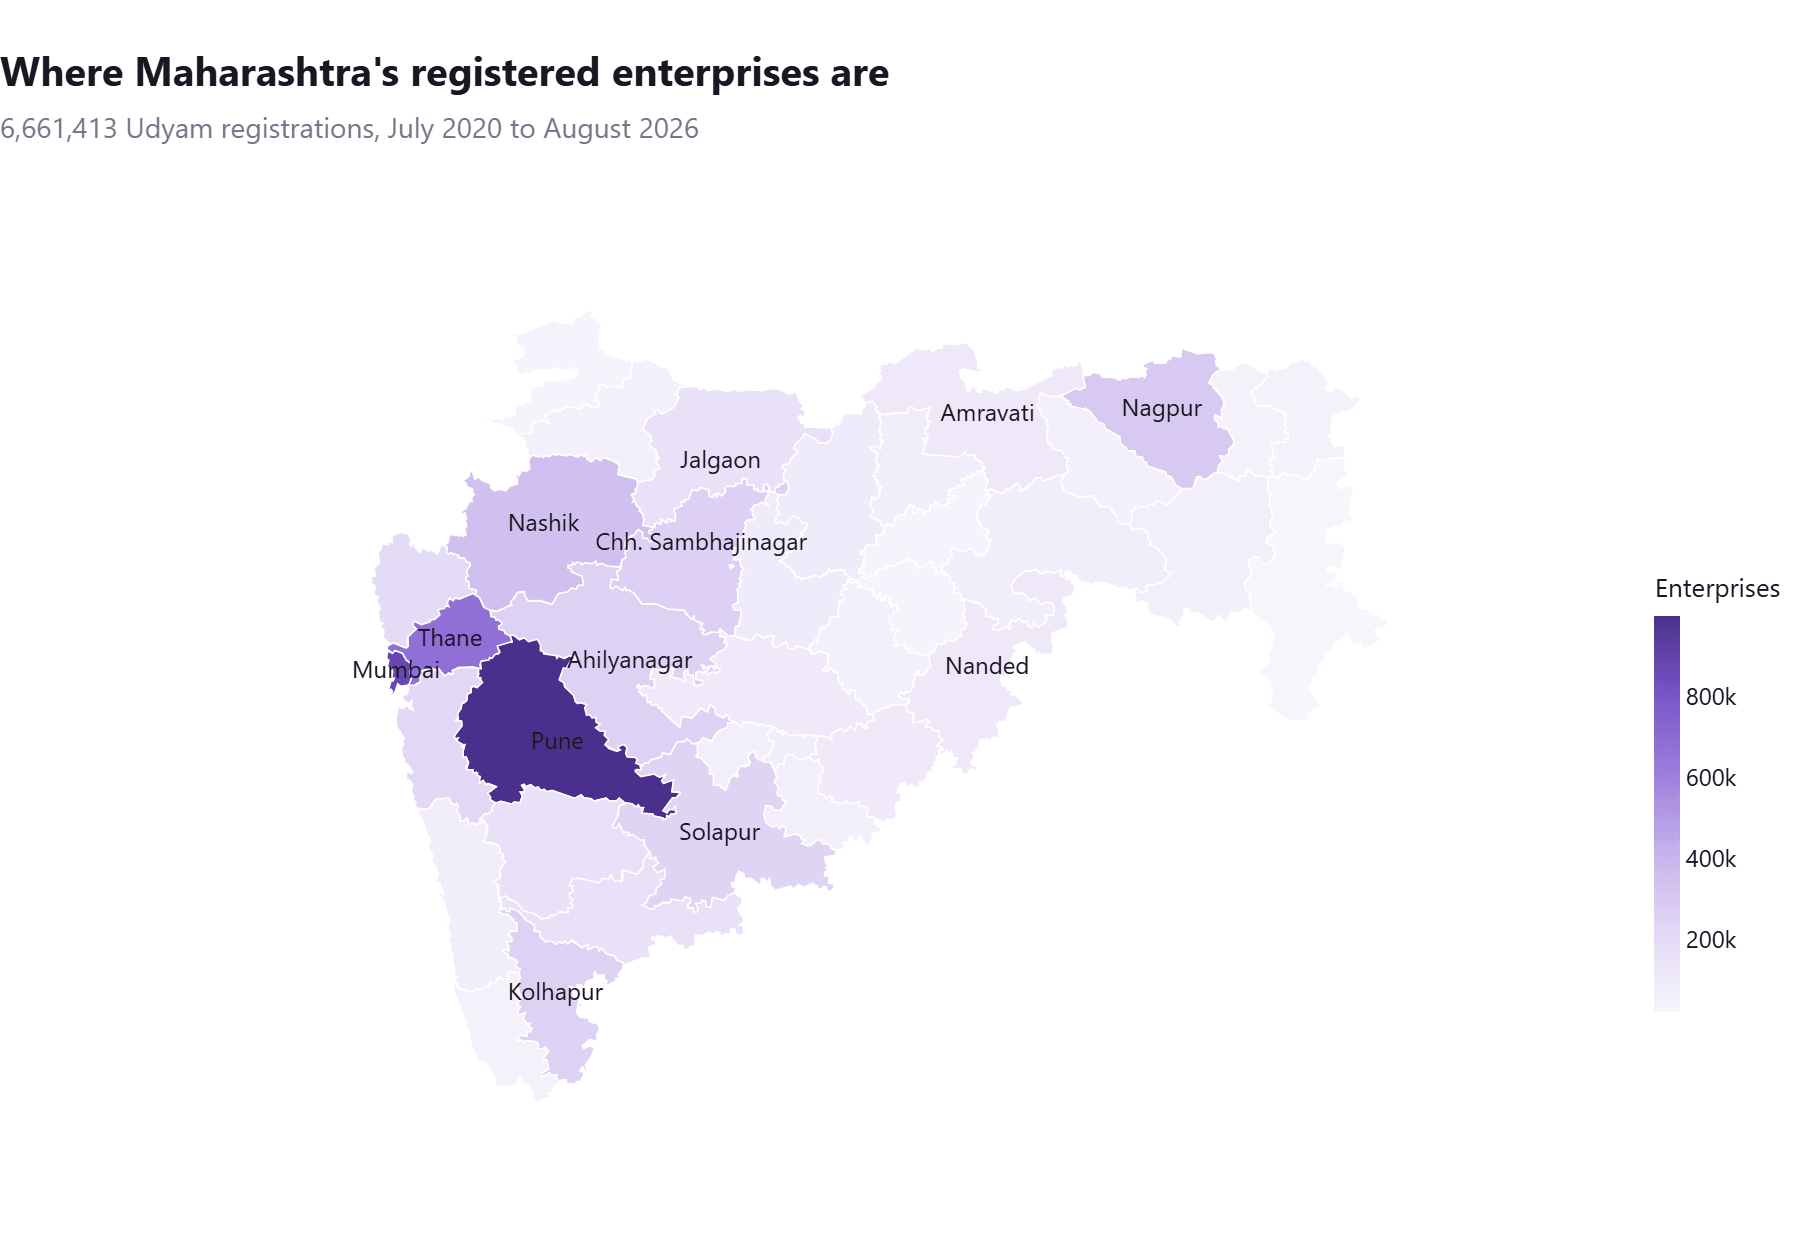
Figure 1. Udyam registrations by district, July 2020 to August 2026. Pune alone holds 15% of the state.
We have built a dashboard that reads them instead. It covers every district in Maharashtra, and it is free and public. We aim to broaden and deepen the scope of this work. In the remaining post, we illustrate certain use cases of the dashboard in its current form.
Five questions, asked of every district
- What This District Does — its composition, and what it does more of than the rest of the state
- What’s Changing — which sectors are growing and shrinking
- Coverage & Concentration — whether activity is spread across the district or piled in one place
- Industry Explorer — drill from a broad sector down to a single activity, against the district’s division and the state
- Where & Spreading — a pincode-level map of where activity sits, and how it has moved since 2020
The registry holds 35 districts, which is complete coverage: Udyam files Mumbai City and Mumbai Suburban under a single Mumbai, so 35 entries cover all 36 districts of the state.
Three examples of what that makes visible.
1. What a district is unusually good at
Every district has food businesses. That is not the surprise. It is an activity built around needs and pleasures of all of us. The question is whether district has strikingly larger share. Sindhudurg does, in fact it is one of the two districts (other being Bhandara, with textiles) where retail trade is not the largest sector. food products are 15.3% of Udyam registered enterprises in Sindhudurg against 6.6% statewide — 2.3 times the state rate, the highest of any district. Drill into the activity and the specialisation sharpens. Processing of edible nuts, which in this case means cashew, runs at 12.7 times the state rate; fruit juices and squashes at 7.4 times; then spices, flour milling, bakery and papads.
The advantage of Sindhudurg for the food sector activities, especially cashew nuts, is well-known. The fact that retail trade does not dominate reflects the declining population and peculiar demographics in Sindhudurg and resulting constraints of local demand. The enterprise activity in Sindhudurg cannot rely on local markets for growth, it will necessarily have to cater to outside demand.
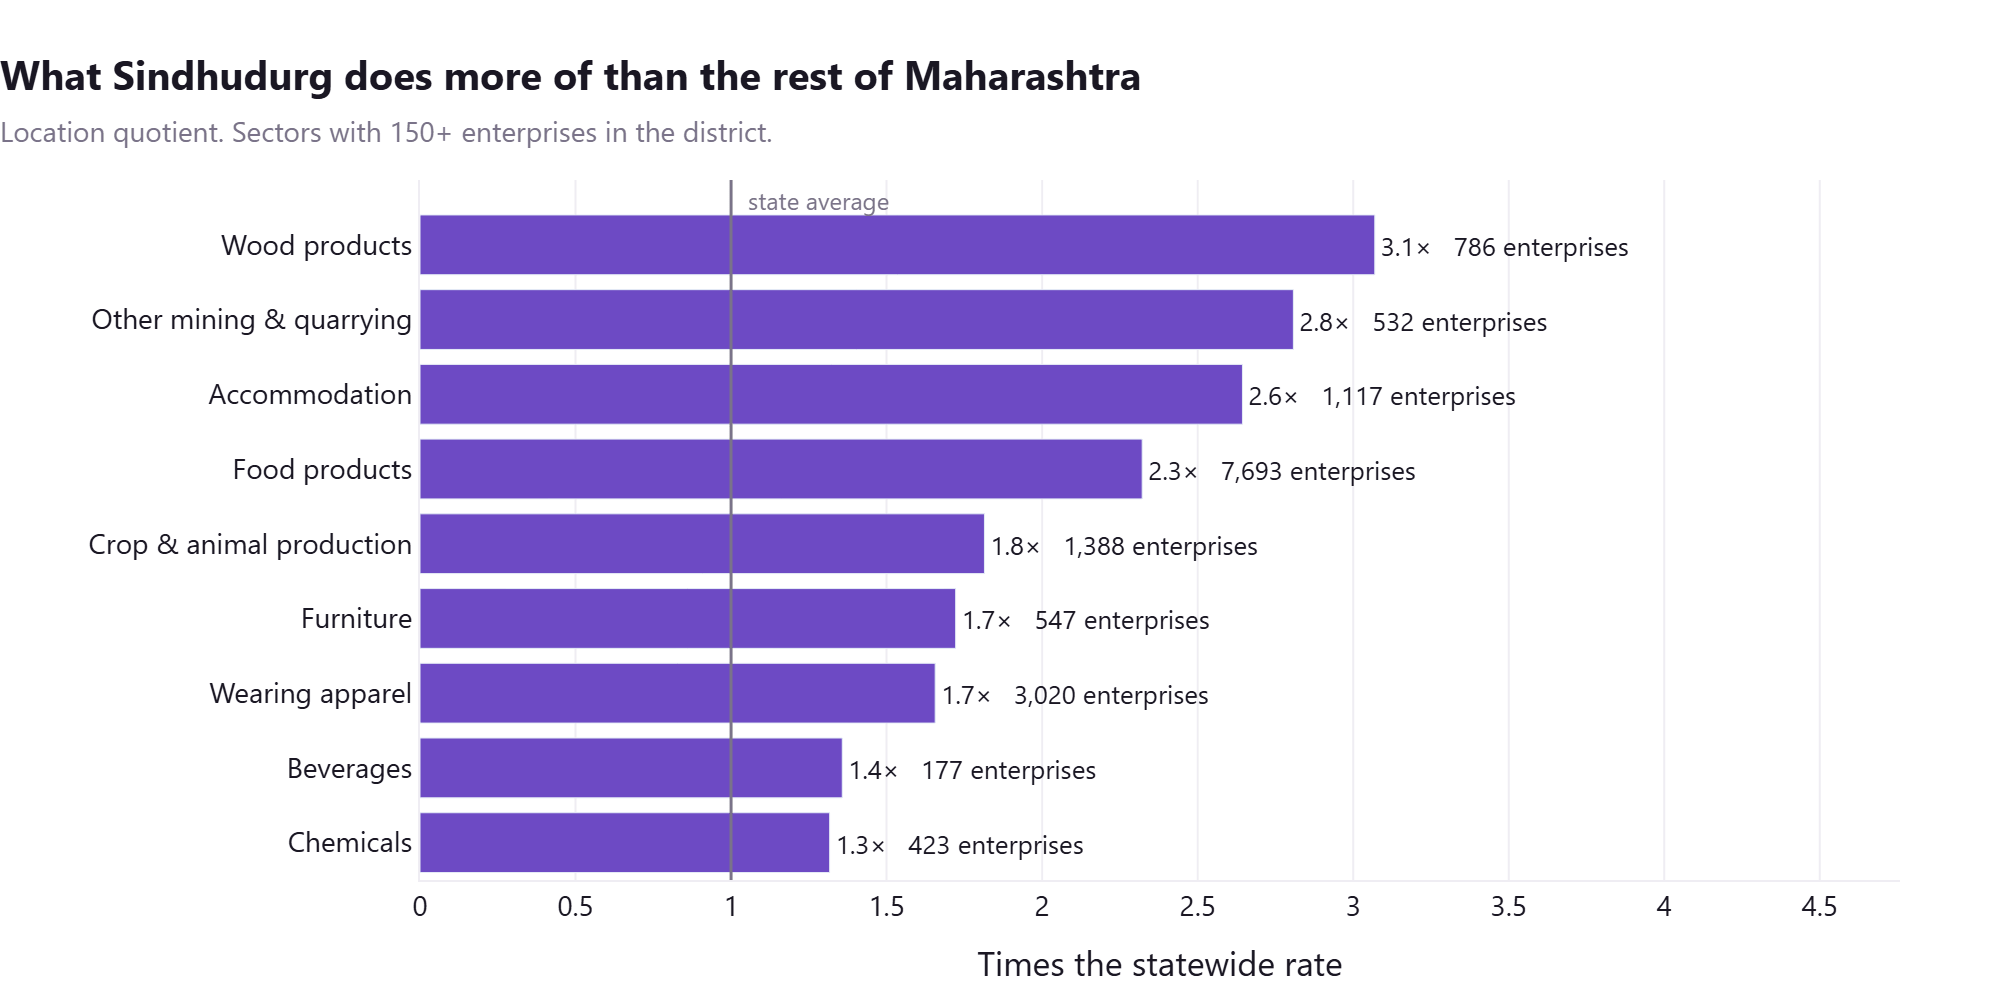
Figure 2. Sindhudurg’s sectors, measured against the statewide rate.
2. What a historic cluster looks like when it is still working
Textiles are 5.3% of Kolhapur’s enterprises. Two-thirds of those enterprises sit in three Ichalkaranji pincodes, and one of them, 416115, holds half of them on its own. That Ichalkaranji is a textile town is not news. What the registration dates add is a way to ask whether the cluster is still pulling.
It is. Comparing where enterprises registered in 2020-22 with where they registered in 2024-26, across 829 district-and-sector pairs, the three pincodes that led a sector early on still take a median 26% of that sector’s new registrations four years later — in districts that typically carry forty or more pincodes of real activity. New enterprise starts where enterprise already is. In Kolhapur the pull has not weakened at all: Ichalkaranji’s share of the district’s new textile registrations has held between 67% and 70% for five years. Nobody is starting a weaving unit in an emptier corner of the district to save on rent.
And yet the town itself has changed. Textiles were 42% of everything that registered in those three pincodes in 2020-21; they are 20% now, while the town’s registration base keeps growing through trade, services and other manufacturing. Both things are true at once. Ichalkaranji is still the only place in Kolhapur where new weaving happens, and weaving is no longer the main thing that starts in Ichalkaranji.
Registration data cannot tell you which mechanism is at work: consolidation into fewer, larger shuttleless-loom units, thinner order books, or a younger generation in the same families choosing something other than a loom. Part of the early drop is an artefact — when Udyam opened in 2020 it absorbed a backlog of existing units re-registering from Udyog Aadhaar, which loads the first two years with established weavers. Settling the mechanism needs the Ministry of Textiles’ powerloom statistics and the cluster’s own records beside this. What the dashboard supplies is the fact that needs explaining — and, for a lender or a scheme designer, the reminder that a shock to the powerloom trade lands on a few square kilometres, not on a district.
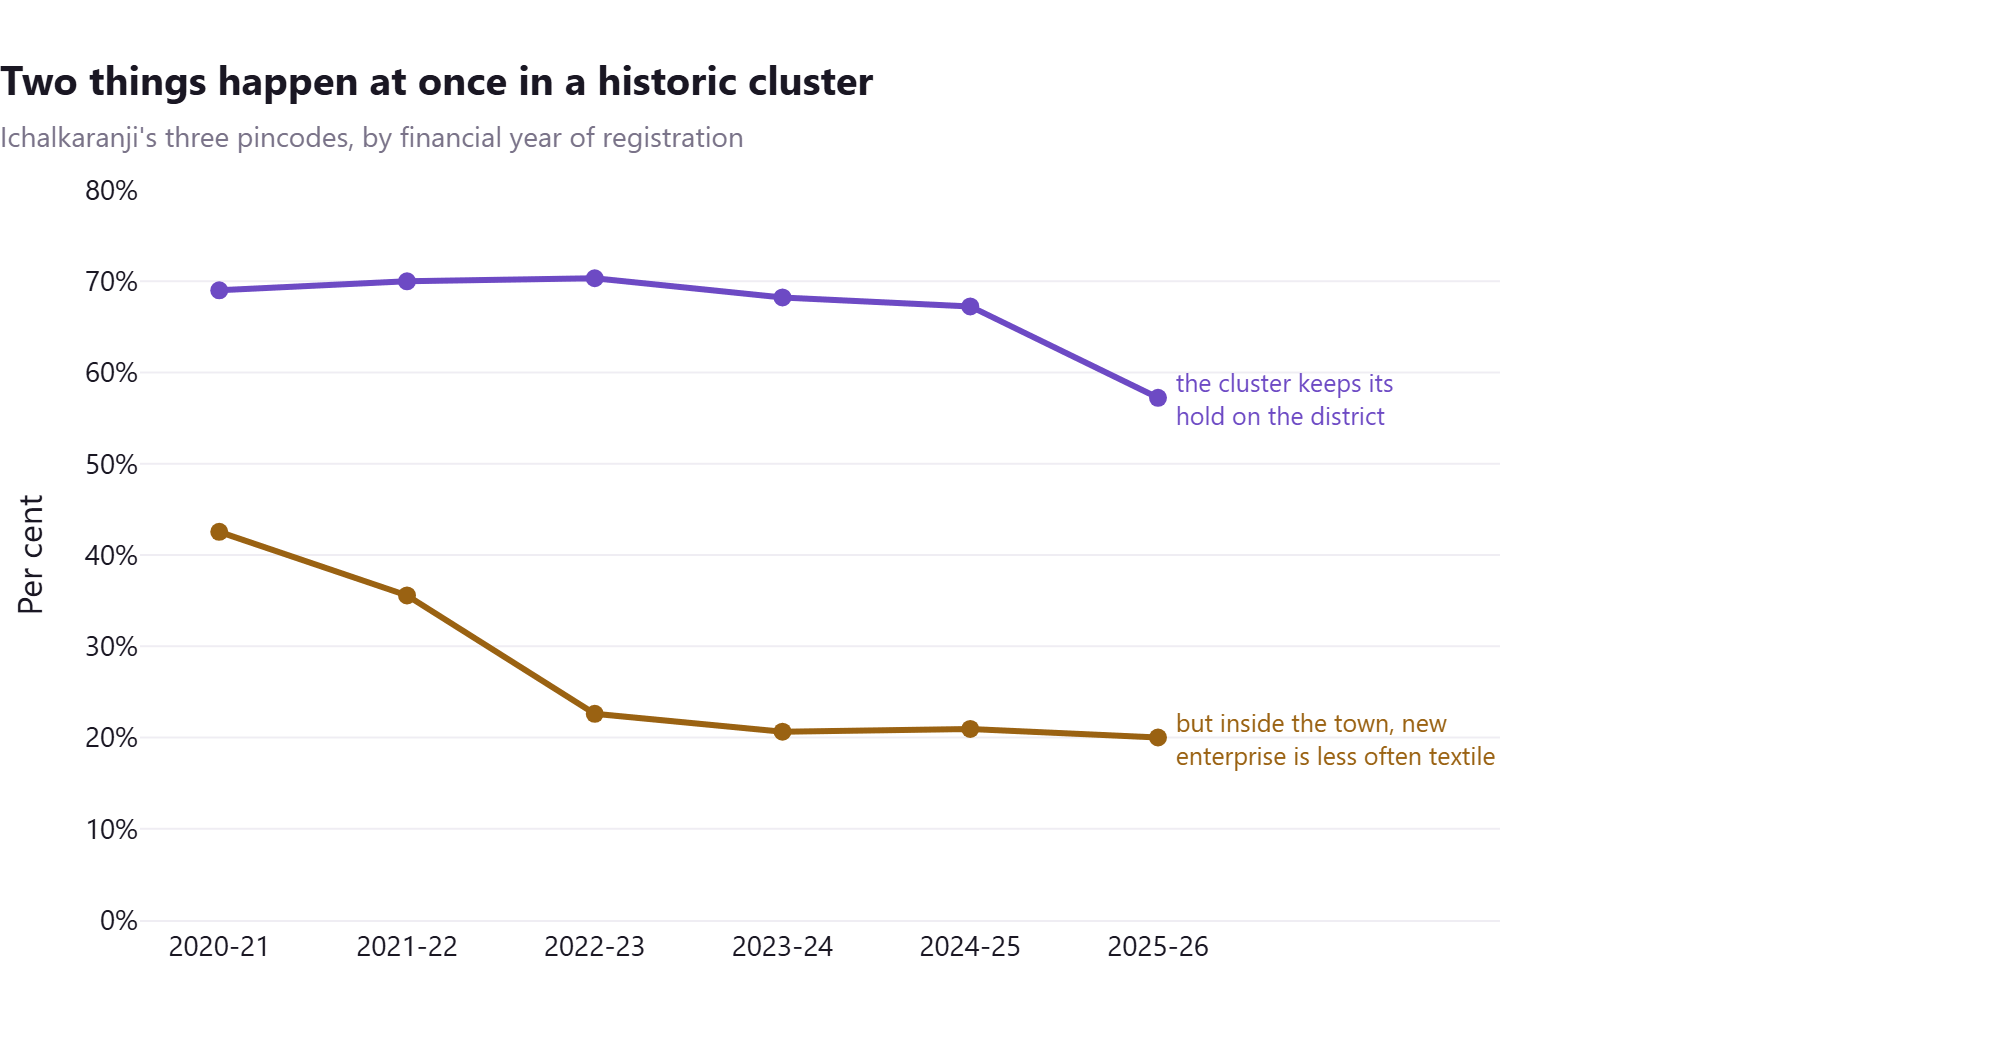
Figure 3. Ichalkaranji’s three pincodes: their share of Kolhapur’s new textile registrations, and textiles’ share of the town’s own new registrations. 2026-27 is left out as a part year.
3. Knowing when a number is about a scheme, not an economy
The strongest specialisation anywhere in our data is wearing apparel in Bhandara: 4.1 times the state rate, higher than any other district-sector pair in Maharashtra. It would be a natural follow-up step to build support around it. But 80% of those 8,012 enterprises registered after June 2025, 3,045 of them in August 2025 alone, and 78% of the activity is custom tailoring. Chandrapur, Amravati and Gondia show the same surge in the same months.
This is a wave of home-based tailors, typically adding to household livelihoods portfolio, entering the register, not a garment industry that grew over a decade. That is worth knowing either way — but it calls for market linkage and credit tailored for self-employed tailors, not an apparel park. A dashboard that only showed the specialisation would have pointed a district straight at the wrong intervention.
![Figure 4. Monthly wearing-apparel registrations in Bhandara. [file: fig3-bhandara-wave.png]](https://blog.deasra.in/wp-content/uploads/2026/09/fig3-bhandara-wave.png)
Figure 4. Monthly wearing-apparel registrations in Bhandara. [file: fig3-bhandara-wave.png]
What the data cannot tell you
We would rather say this plainly than have a reader discover it later.
- These are registrations, not active businesses. Udyam registration is free and one-time, so the count cannot show whether a unit is still trading.
- Registration drives, from government and due to civil society organizations, move the numbers as much as voluntary decision on the part of enterprise does — the Bhandara example above.
- There are no employment, turnover or population figures in the public data, so the dashboard can say what a district does and where, but not how much it produces or employs.
- A pincode is not a village or a block, and about 2.9% of registrations statewide carry a pincode belonging to a neighbouring district. Those enterprises are counted everywhere, but never used to name a place.
What comes next
Two things we are working on. The first is a block-level view: most of the variation in economic structure within Maharashtra sits inside districts rather than between them, and a taluka is the unit at which most schemes are actually delivered. This is perhaps true for many other states in India. The second is treating Udyam as a high-frequency indicator — it is the district-level enterprise series in India that can be updated monthly rather than annually — which means separating the registrations that behave like firms from those that reflect self-employment.
Try it
The dashboard is at insights.deasra.in. Every district page carries its own caveats, and the underlying method is documented in the app. We would like to hear from district officials, banks, researchers and enterprise-support organisations about what is missing: insights@deasra.co.in.
Data note: figures in this piece are from the dashboard’s 22 August 2026 data vintage. The dashboard is refreshed monthly, so current figures may differ slightly. Source: Udyam registration data published by the Ministry of Micro, Small and Medium Enterprises on data.gov.in.