
What Does Udyam Registration Data Reveal About a District? – The Case of Pune
This blog post is inspired by this article in IDEAS FOR INDIA. The article outlines the potential of data from the Udyam portal to study hyperlocal economic activity. In this article, I will illustrate how we can learn about economic activity in the district using granular Udyam registration data. As I will argue, Udyam portal data provides some interesting insights, but for useful policy research, it perhaps has limited applicability on its own in its current form.
Accessing the data
The data used for the demonstration in this article is accessed from data.gov.in. The data download requires a login ID creation, unlike many other datasets at data.gov.in, which can be downloaded without a login ID. As of now, data is available through district-level sets. We need to select the state and the district. The Udyam registration data for the selected district can be downloaded in spreadsheet form (which neither my colleague nor I could) or as an API. I used the APIs to download, using the dates of registration. I could download 99.6% of the available data for the Pune district as of 20th March 2026, consisting of about 9.1 lakh entries.
The following information is provided for each record: state, district, registration date, pincode, address, and a list of NIC-5 activity codes. There is no information on turnover, employment, or investment or MSME status. The combination of pincode, date, and activity codes allows spatial and sectoral analysis at a granularity that is not available from any other continuously updated source.
Pune district registrations over the years
In Figure 1, we see the quarter-wise registrations in Pune district from Q3 of 2020 (September 2020 onwards) till Q1 of 2026 (March 2026). Udyam registrations were launched in June 2020, broadening the scope of the already existing Udyog Adhar.
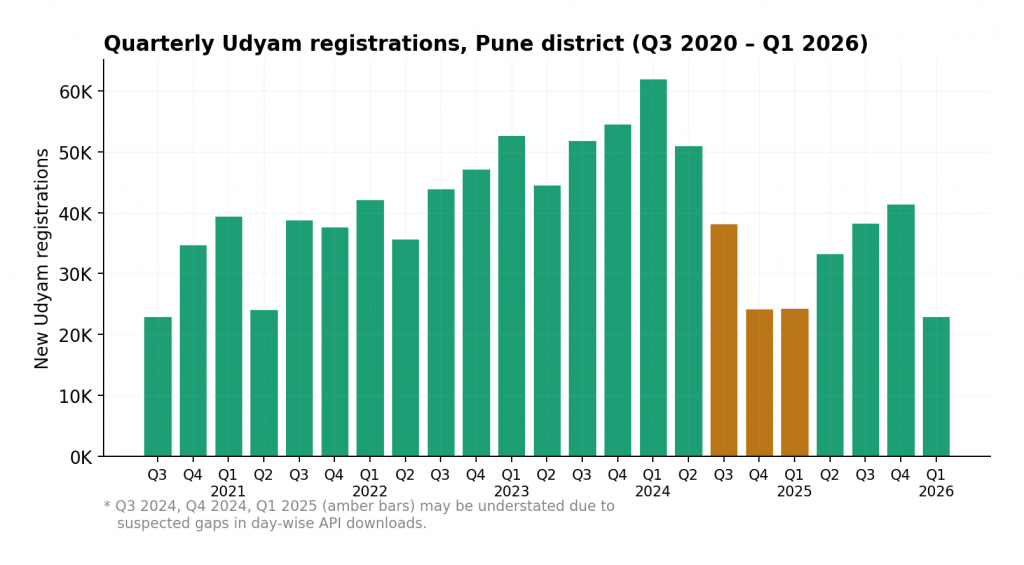
Figure 1: Quarterly Udyam registrations in Pune district
Not all these registrations reflect new business activity. It is most likely that in early phases of these registrations, existing businesses, which were part of several databases like Udyog Adhar, GST, FSSAI, Shop Act licenses and were already running for some time, have obtained the Udyam. We see a conspicuous drop from September 2024 to March 2025, for which it is not ascertained whether a glitch is due to the data download approach or a feature of the registration pattern.
Key sectors
Figure 2 shows the sectoral distribution among Udyam-registered enterprises in Pune district. Since 2022, we have seen a steady pattern of distribution across sectors.
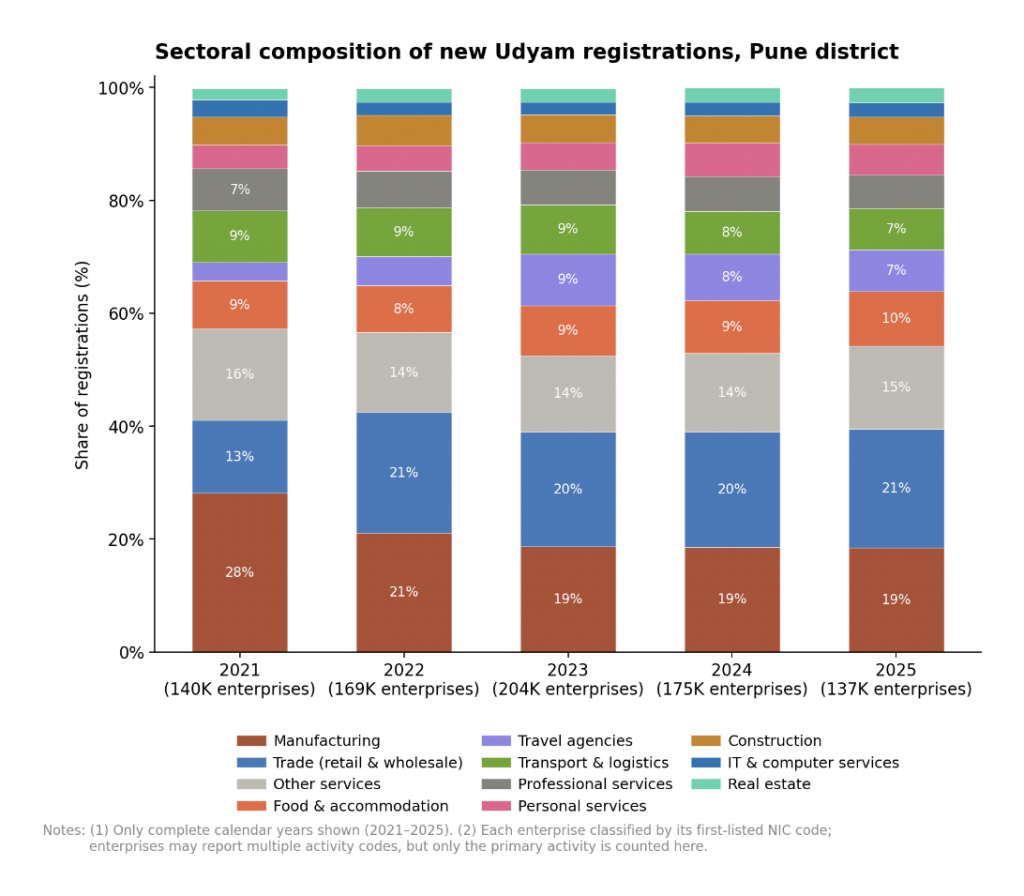
Figure 2: Key sectors in Udyam enterprises in Pune district
Manufacturing and trade account for about 40% of the registrations, with nearly equal shares of each. Other services, a residual category that includes several NIC codes classified as “not elsewhere classified,” account for about 15%. Food and accommodation account for about 9%. Travel agencies are a somewhat surprising entry, accounting for about 7% share. This includes solo car operators as well, which explains the large share. Pune district contains two large urban centres, Pune and Pimpri-Chinchwad, and cab operators function in large numbers in and around these centres. Udyam registration is often mandated for loans, and hence these operators are seen in large numbers. Transport and logistics, professional services, personal services, and construction each account for 5–7%.
Distribution of enterprise activity across the district
Since the pincode of every Udyam registered enterprise is available, it is possible to map (with good accuracy) the enterprises to various administrative divisions, like Talukas. Figure 3 shows that the distribution of enterprises across two major urban centres and the rest of the district has largely remained the same, with the rest of the district enterprises growing somewhat more rapidly than those in the two major urban centres.
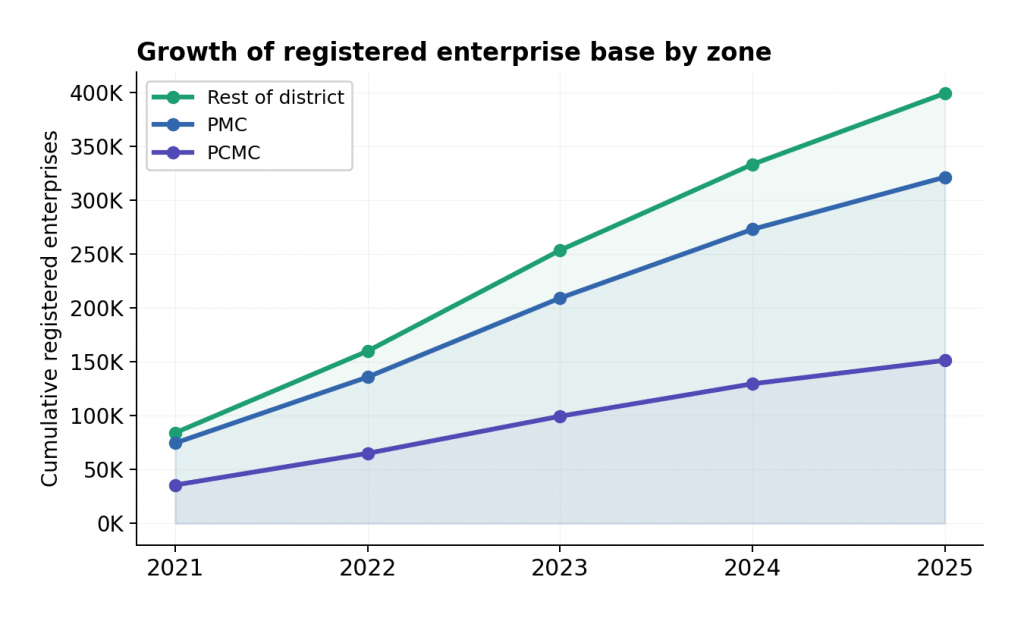
Figure 3: Udyam registration growth in urban centres and the rest of the Pune district
Figure 4 shows the sectoral composition of enterprises across two major urban centres and talukas of the Pune district. PCMC and Bhor show the largest share for manufacturing, while Pune, Haveli, and Mulshi (all around the Pune municipal area) show the least proportion. Trade and transport, and logistics show the largest proportion in Shirur and Daund. The broad point is within the district; composition is not uniform, and spatial legacies and the nature of the urban core seem to play a role. Figure 5 shows more about the spatial aspect of sectoral composition.
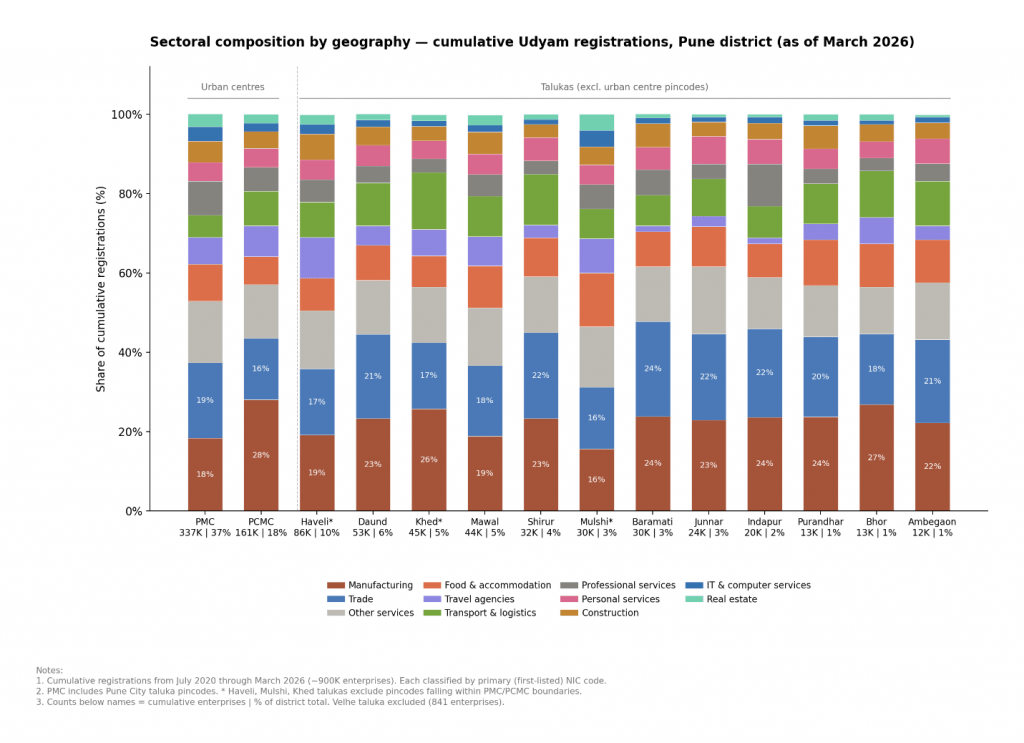
Figure 4: Sectoral compositions across talukas and urban centres in Pune district
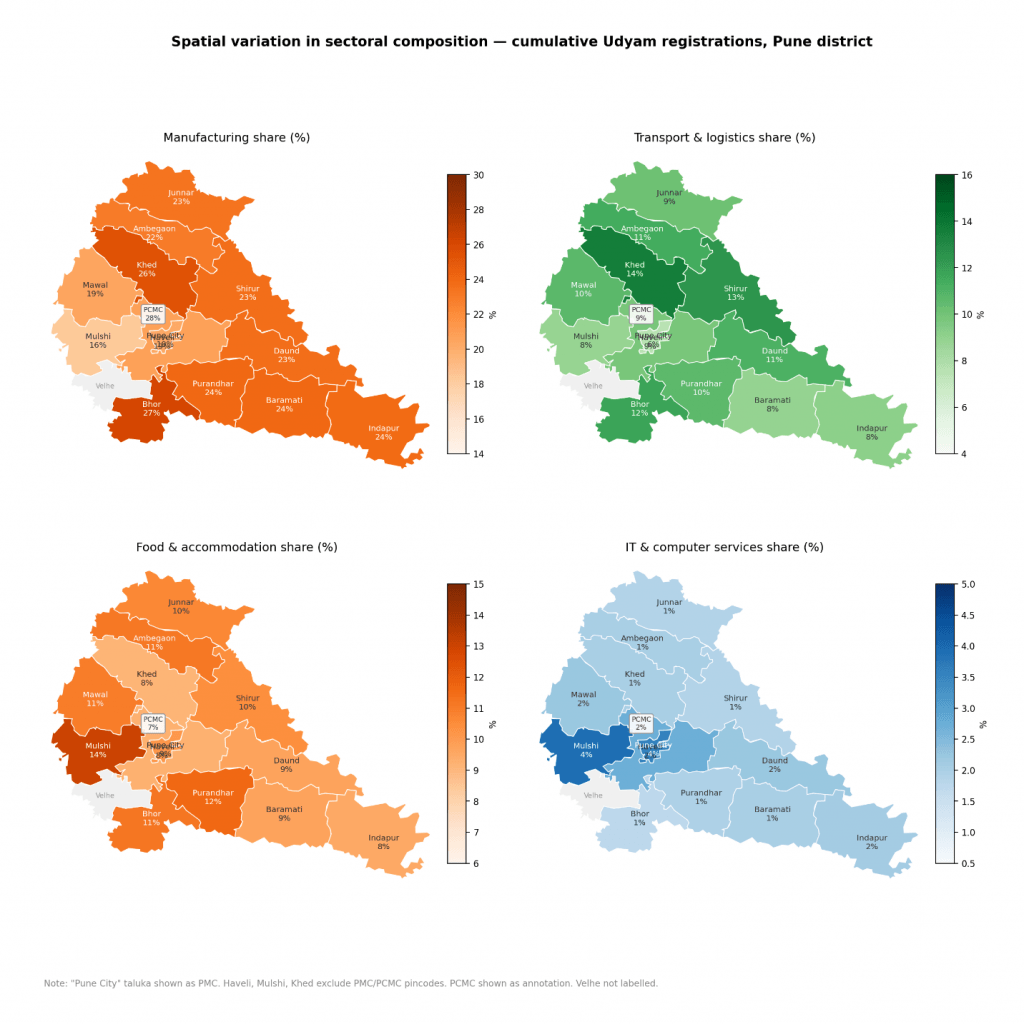
Figure 5: Spatial variation in sectoral composition
Manufacturing share is highest in PCMC (28%) and talukas along the eastern and southern belt – Bhor, Khed, Baramati, Indapur, and Shirur – all between 23% and 27%. This concentration reflects the MIDC industrial zones. PMC and Mulshi, by contrast, have the lowest manufacturing shares at 18% and 16% respectively, a sign of an underlying metropolitan economy where services play a dominant role. Transport and logistics show a distinct semi-urban gradient, peaking in Khed (14%), Shirur (13%), and Bhor (12%), where goods movement from agricultural and industrial hinterlands is intensive, while PMC registers only 6%. It is possible that many of these businesses, which are likely to be predominantly solo operators, function in Pune and PCMC but are registered at their rural base. Food and accommodation is most prominent in Mulshi (14%), which hosts a growing tourism and hospitality cluster around the Mulshi dam and Lavasa corridor. IT and computer services show the agglomeration effect most starkly, though at an overall low share: PMC and Mulshi (which hosts the Hinjawadi IT park) show 4% each, while every taluka is at 1–2%.
Planned zones and organic manufacturing
Since we know the locations of MIDC industrial zones in the district, we can ask a more pointed question: how much of the manufacturing activity is inside these planned zones, and what kind of manufacturing happens outside them?
Figure 6 shows, for selected manufacturing activities, what proportion of enterprises are located in designated MIDC or industrial estate pincodes. It must be noted that assigning MIDC to pincodes is approximate and driven more by illustrative purpose than accuracy. Capital-intensive activities – machine tools, forging, auto components, machining – have 55–73% of their enterprises inside planned zones. These are activities that genuinely depend on industrial infrastructure: reliable power, waste handling, and heavy-vehicle road access. At the other end, food processing, tailoring, jewellery, and brick-making have only 4–14% in the MIDC zones. These are market-proximate or raw-material-proximate activities that are located near their customers or inputs and do not have critical dependence on industrial infrastructure.
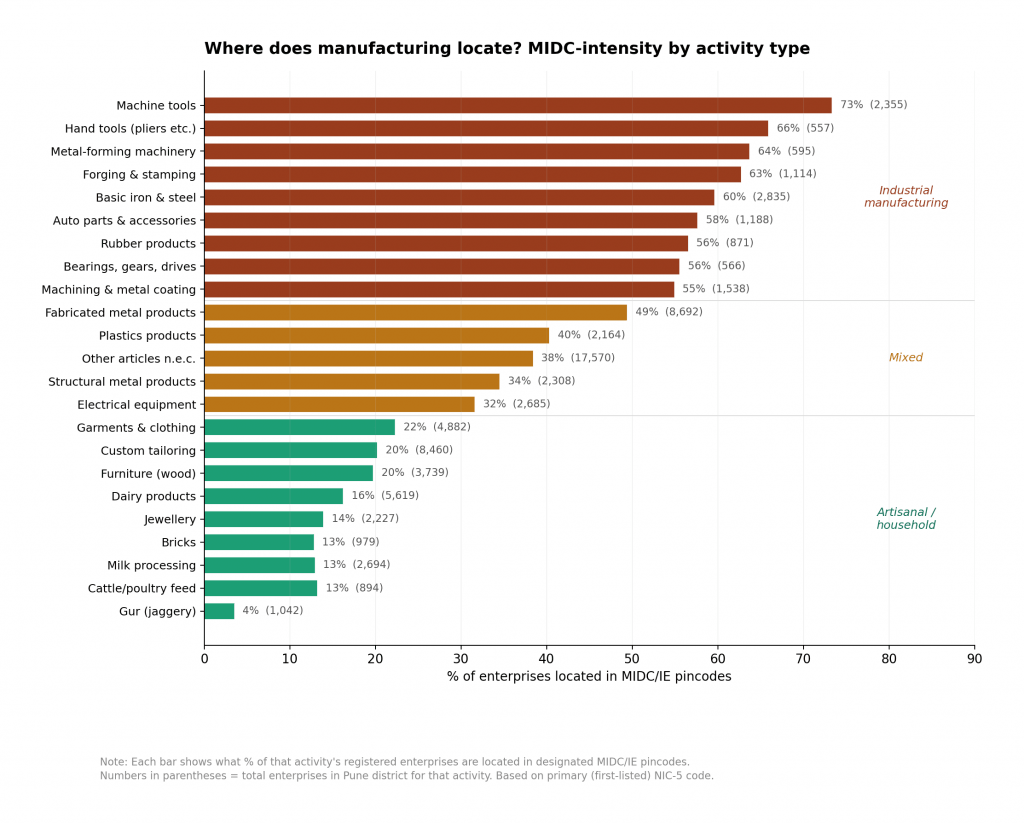
Figure 6: MIDC-intensity by activity type
By count, nearly 70% of Pune’s registered manufacturing enterprises are outside the MIDC zones. But most of these are nano-scale units as compared to larger units in MIDC – custom tailoring, food processing, furniture-making. What the data does reveal, however, is a genuine spatial gradient around the oldest planned zone. Figure 7 shows how industrial manufacturing intensity (metals, machinery, vehicles, rubber and plastics) decays with distance from Bhosari MIDC, which has operated for over fifty years: from 42% in the MIDC pincode to 11% within 5 km, 8% within 10 km, and stabilising at 5% beyond 20 km. This gradient is not visible around newer zones like Ranjangaon, Kurkumbh, or Talegaon, which might not yet have generated the thick supplier ecosystems and labour pools that produce spatial spillovers.
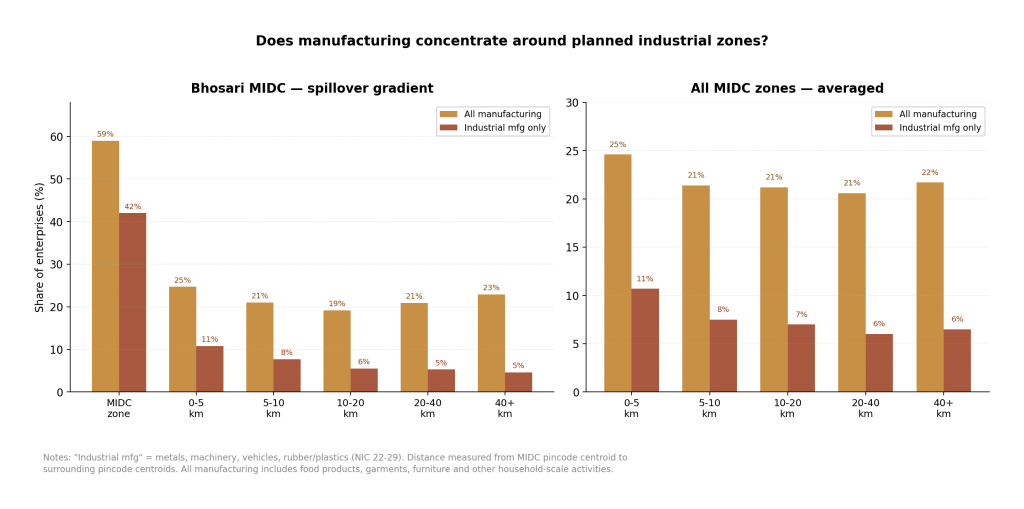
Figure 7: Manufacturing intensity around MIDC zones – Bhosari vs average
The observations highlight the role of planning in encouraging industrial development – larger units are located in these designated zones while smaller activities mushroom across the districts.
Evolution of clusters
Enterprises often exist in clusters to exploit the positive externalities of learning from each other and finding easier access to markets. Pincode-level information from Udyam data allows us to see how enterprise clusters have emerged and grown in the district. This is shown for select industries in the following interactive visualisation.
The key observation on the evolution of clusters is that, barring food products, all other industries show clusters growing and thickening around the urban core of Pune and PCMC. This is not a negative observation. Urban core provides the market access for both inputs – physical and human, and outputs.
Limitations
Udyam registration is voluntary for most enterprises and is incentivised primarily through access to priority sector lending and government procurement preferences. Enterprises that do not seek these benefits will not appear in this data. The dataset, therefore, has a selection bias towards enterprises that are somewhat formalised or seeking formalisation.
Registrations are a stock with no exits. An enterprise that registered in 2021 and subsequently shut down continues to appear. We cannot distinguish active from defunct enterprises in the current form.
We also cannot currently infer new business formation from registration flows. Much of the early registration wave likely represents existing enterprises obtaining Udyam numbers rather than genuinely new starts. However, as Udyam registration becomes more universal over time – particularly if it is increasingly linked to lending, compliance, and government schemes – the annual registration flow will converge towards actual new enterprise creation, making it a useful proxy for business formation.
The NIC classification is self-reported and uneven. The large “travel agencies” share likely includes solo cab operators, and several residual “not elsewhere classified” codes are disproportionately large. The pincode-to-geography mapping involves approximations, particularly in rapidly urbanising areas where Census boundaries lag behind actual settlement patterns.
Further directions
The demonstration in this article is limited to what a single administrative dataset can reveal. As we see, it shows that planning influences the nature of enterprise evolution, and access to market is another force that shapes the evolution of consumer-facing industries. These lessons are not new, and this novel data set vindicates what is already accepted wisdom.
Udyam registration data, by itself and in its current form, tells us where enterprises are registering and what they report as their activity – not whether they are active, productive, or generating employment. Registration is not a proxy for economic vitality. Several extensions, however, can make this data substantially more useful.
The most immediate use is as a sampling frame. Researchers studying nano-enterprises currently rely on NSSO or Economic Census frames that are either not updated to match the rapidly evolving reality or not representative at smaller administrative units. Udyam provides a current, pincode-level list of enterprises by sector. A researcher wanting to study, say, the working conditions and income levels of fabricated metals enterprises in the PCMC belt can use Udyam data to identify exactly which pincodes to sample from, and how the population is distributed across them. This is infrastructure for field research, not a substitute for it.
A second use is in evaluating policy interventions. The pincode-level time series of registrations naturally supports difference-in-differences research designs. When a new MIDC zone is designated, does enterprise registration in surrounding pincodes increase relative to comparable pincodes elsewhere and with what time lag? Our analysis suggests that Bhosari MIDC, which has operated for over fifty years, shows a clear spatial gradient of industrial activity in its surroundings – a gradient absent around newer zones like Ranjangaon and Kurkumbh. This is a testable hypothesis about how long industrial policy takes to generate agglomeration externalities, and Udyam data provides the outcome variable at the right spatial and temporal resolution.
Third, combining Udyam data with other spatial indicators can address the limitation that registration does not equal activity. District-level bank credit data from RBI, for instance, is too aggregate to be informative – we found no meaningful co-movement between quarterly Udyam registrations and total bank credit for Pune district. But MUDRA disbursement data at the branch level, or MSME credit data from SIDBI, could be matched to Udyam registration pincodes to ask whether areas with high registration density also show high credit uptake. Night light intensity data, which captures aggregate economic activity at high spatial resolution, offers another complementary signal. Pincodes where Udyam registrations are not surging but night light intensity is increasing may indicate a greater role of consumption than production in local economic activity. The discrepancy between the two signals is more informative than either alone.
Finally, the approach demonstrated here for Pune can be replicated for any district in India using data already available. A systematic effort to download, clean, and analyse Udyam data across districts could produce a continuously updated map of the formalising enterprise base – not an index of economic activity, but a spatial infrastructure that makes targeted research and policy evaluation possible at a granularity that does not currently exist outside of decennial census exercises.
Explore More Insights
Interested in more research and analysis on entrepreneurship, livelihoods, and India’s evolving economy? Discover our latest blogs and data-driven perspectives.