Deepening but not expanding: credit to India’s unincorporated enterprises, 2010–2025
The recently released report of the latest round of the Annual Survey of Unincorporated Sector Enterprises (ASUSE) reported that about 80 per cent of the credit to unincorporated enterprises is from institutional sources. In this piece, we trace credit to unincorporated enterprises over time and place the latest numbers in some context. We do so using six rounds of surveys: two NSS rounds in 2010–11 and 2015–16, and four ASUSE rounds — 2021–22, 2022–23, 2023–24, and 2025. All these rounds exclude agricultural and construction enterprises, allowing broad comparability. Their coverage has changed over time, and we account for this by working with a consistent subset of enterprise types covered across all six rounds. In the case of credit, the exclusion of some enterprise types from the consistent dataset has important implications.
Self-help groups and the institutional credit headline
We exclude self-help groups (SHGs) from the consistent dataset. The survey captures SHGs under NIC 64309 — a five-digit code for ‘other monetary intermediation’ — treating them almost entirely as financial intermediaries. Any collective non-financial business run by SHG members is covered separately, as explained in the methodology documentation. Table 1 shows the role of SHGs in key survey results.
| Round | Establishments % | Workers % | GVA % | Reported institutional credit % |
| NSS 67 (2010–11) | 2.00 | 4.97* | 0.22 | 8.17 |
| NSS 73 (2015–16) | 1.84 | 0.06 | 0.14 | 6.74 |
| ASUSE 2021–22 | 3.12 | 1.29 | 0.53 | 17.45 |
| ASUSE 2022–23 | 3.67 | 0.17 | 0.50 | 17.67 |
| ASUSE 2023–24 | 3.71 | 0.13 | 0.55 | 20.86 |
| ASUSE 2025 (Jan–Dec) | 3.75 | 0.39 | 0.60 | 28.59 |
Table 1: Role of SHGs captured in the unincorporated enterprise survey, reported master. *NSS 67 worker figure reflects methodological differences in recording workers across rounds.
It is evident from Table 1 that excluding SHGs from the consistent coverage has a significant bearing on credit numbers. SHGs account for more than a quarter of the reported outstanding institutional credit in 2025, and this share has grown rapidly across ASUSE rounds. At the same time, SHGs are not enterprises in the productive sense — they are intermediaries that borrow from banks and pass credit on to their members. Their inclusion adds confusion, especially to credit numbers, when credit is understood as a factor in enterprise productivity. Their exclusion has modest implications for employment and value-addition numbers, with the partial exception of the NSS 67th round — which shows an anomaly in the workers column attributable to methodological changes in recording workers across rounds — and ASUSE 2021–22, where the employment share is higher than in adjacent rounds.
A note on how the survey captures credit. The survey records outstanding loans as a stock on the last day of the reference period. Loans repaid before the survey date are invisible; loans taken and fully repaid within the year do not appear at all. The schedule also restricts recording to credit drawn explicitly for establishment purposes — personal loans of the proprietor, gold loans, or property-backed loans used in the business are excluded by design, regardless of how the funds were ultimately deployed. And the survey asks the establishment about its liabilities, not the proprietor about hers: a MUDRA loan in the individual proprietor’s name may or may not be reported in Block 11, depending on how the respondent classifies it. These features explain, in part, why ASUSE credit figures are substantially lower than commercial bank data on MSME credit, which we return to later. Readers should keep them in mind when interpreting every table that follows.
How much credit, and from where?
The first important observation on credit for unincorporated enterprises is the low share of enterprises reporting any outstanding credit.
| Round | NSS 67 (2010–11) | NSS 73 (2015–16) | ASUSE 2021–22 | ASUSE 2022–23 | ASUSE 2023–24 | ASUSE 2025 |
| Total establishments (crore) | 5.54 | 6.12 | 5.62 | 6.02 | 6.64 | 7.55 |
| % reporting any borrowing | 8.13 | 12.2 | 8.35 | 9.83 | 8.25 | 8.1 |
| Among borrowers: % with institutional loan | 48.5 | 41.5 | 48.0 | 43.9 | 47.5 | 41.2 |
| Among borrowers: % with non-institutional loan | 55.0 | 63.1 | 56.4 | 59.7 | 55.5 | 61.3 |
| Institutional sources: % share of total credit outstanding | 75.2 | 77.2 | 73.6 | 79.2 | 74.6 | 77.4 |
| Median institutional loan, when borrowing (Rs) | 80,000 | 90,000 | 1,00,000 | 1,35,000 | 1,50,000 | 1,75,000 |
| Median non-institutional loan, when borrowing (Rs) | 15,000 | 20,000 | 20,400 | 20,000 | 25,000 | 25,000 |
Table 2: Key indicators of credit to unincorporated enterprises, consistent coverage across rounds. Source: author’s calculations from consistent cross-round masters.
Table 2 shows some key indicators across six rounds. The percentage of unincorporated enterprises with any borrowing peaked in 2015–16, and the 2025 figure is the lowest across all six rounds. Even at the peak, about one in eight enterprises reported any outstanding credit. That ratio is now closer to one in twelve. Given that the enterprise universe has grown by 1.4 crore since 2015–16, the absolute number of borrowing enterprises has fallen even as the total population grew.
Among total outstanding credit, summed across all borrowing enterprises, institutional credit has accounted for roughly 75 per cent across all six rounds. But this aggregate figure obscures the fact that more than 60 per cent of borrowing enterprises hold outstanding credit from non-institutional sources, and this percentage has risen in 2025 compared to previous rounds. The exclusion of SHGs from the consistent dataset raises this percentage, but since SHGs account for only about 4 per cent of establishments, the proportion would remain substantially higher than the institutional share even on the full reported dataset. At the same time, the percentage of borrowers with institutional credit outstanding has declined — and is at its lowest across the six rounds. The median outstanding credit from non-institutional sources has been stagnant or growing slowly across rounds, while median institutional credit has outpaced it and is now about seven times higher.
This difference in median amounts explains why the share of institutional credit in total outstanding is high despite institutional credit being held by only 40 per cent of borrowers. When an enterprise does access institutional credit, it tends to borrow a substantially larger amount. This is worth bearing in mind when reading the 80 per cent institutional share headline — it reflects loan size composition more than borrower coverage.
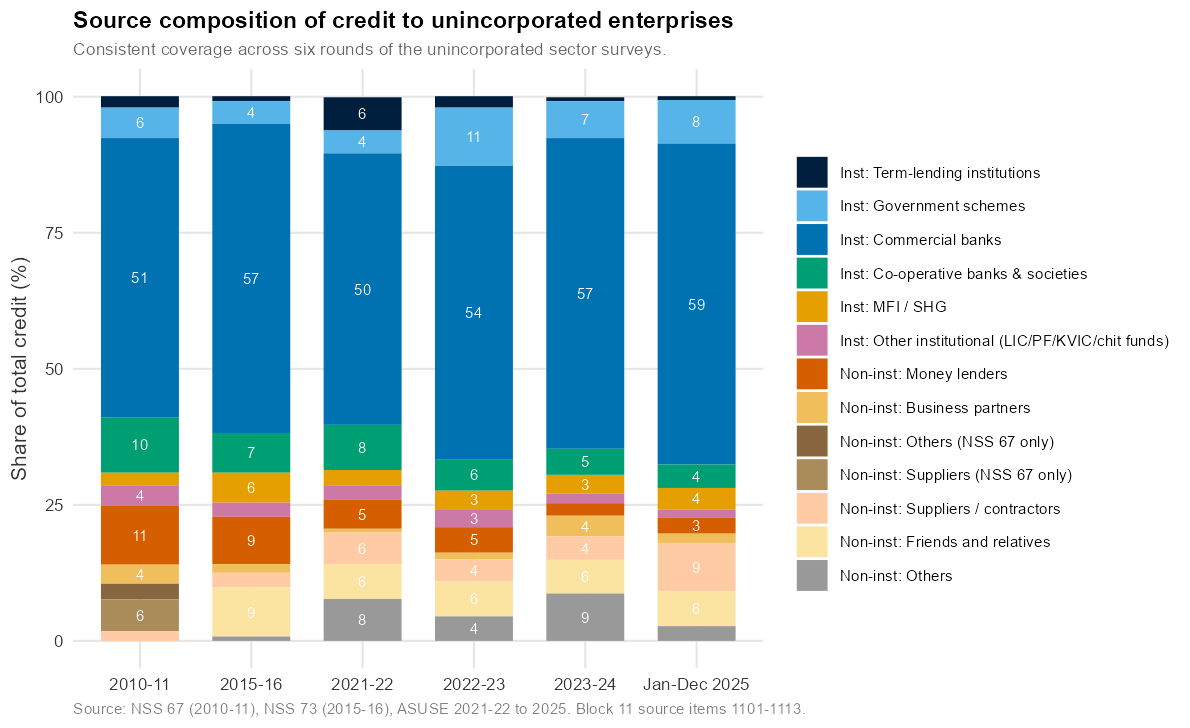
[Figure 1: Decomposition of outstanding credit by source, across rounds]
Among non-institutional sources, moneylenders have been declining as a share of total outstanding credit, while friends and relatives have remained roughly constant at around 6 per cent, and supplier and contractor credit has grown in its role (Figure 1). The declining role of moneylenders is sometimes read as straightforwardly positive, but it is worth noting that moneylenders, whatever their cost, have historically provided enterprises with accessible, flexible, and collateral-light credit — particularly for seasonal or emergency working capital needs. Whether their decline reflects genuine substitution by better formal credit or a withdrawal of liquidity from enterprises that cannot access formal alternatives is not something these data can determine.
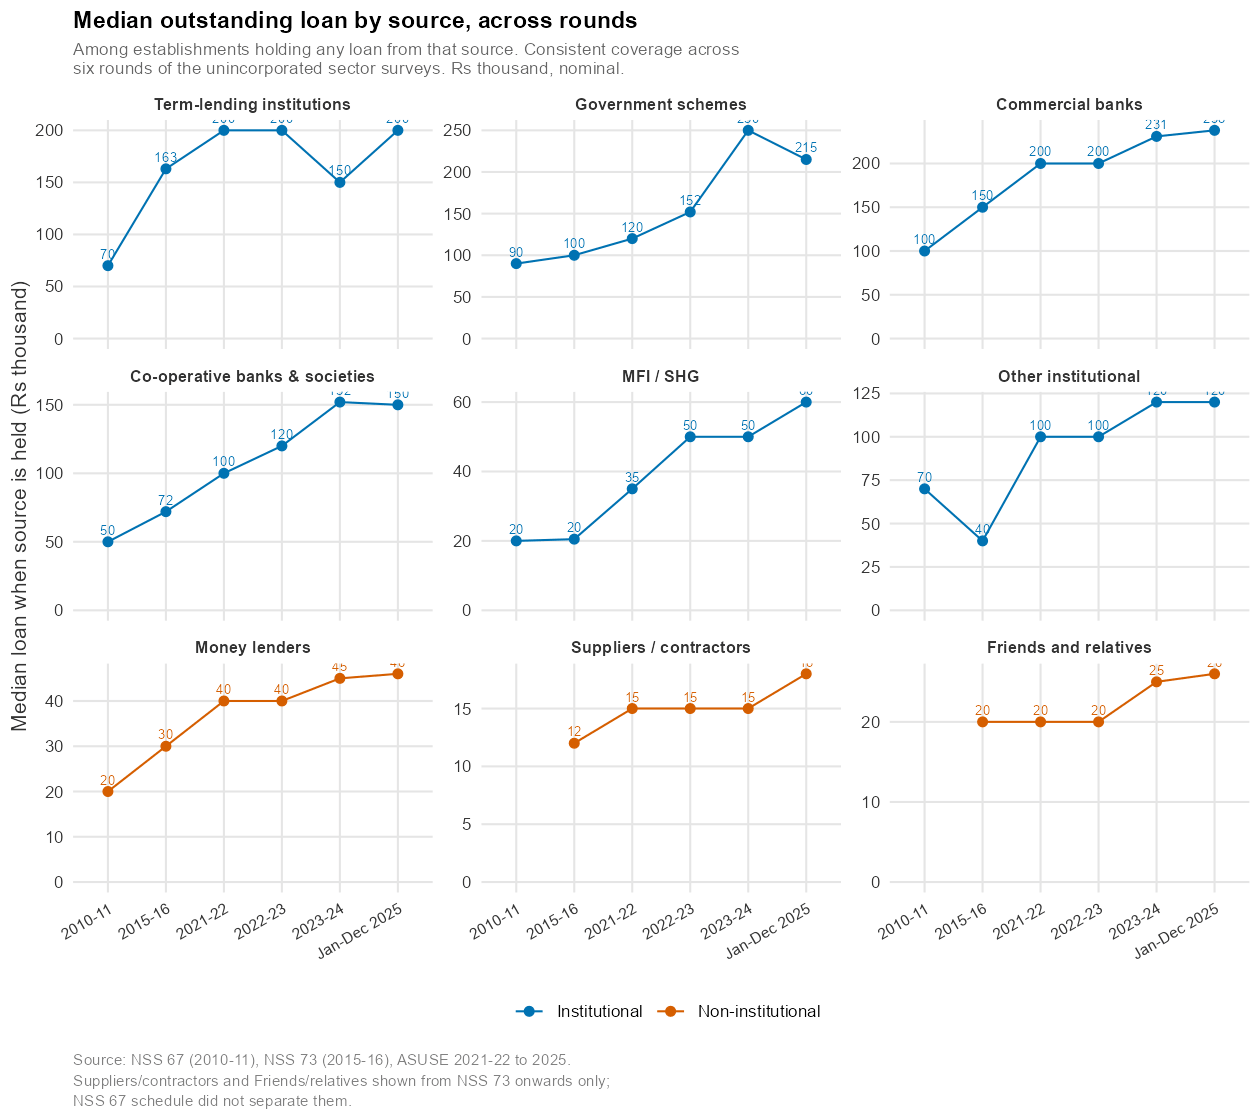
[Figure 2: Median outstanding credit by source, across rounds]
As Figure 2 shows, institutional sources account for much larger outstanding credit for the median borrower compared to non-institutional sources. Even as moneylenders are losing share of total credit, their median outstanding amount has been crawling upward, though at a slower pace and lower absolute level than institutional sources. Commercial banks are the mainstay, with the median borrower reporting outstanding credit of Rs 2.25 lakh as of 2025.
Who gets credit?
An obvious question about credit is who gets it. One natural expectation is that enterprises with higher turnover are more likely to have credit, and more likely to have institutional credit.
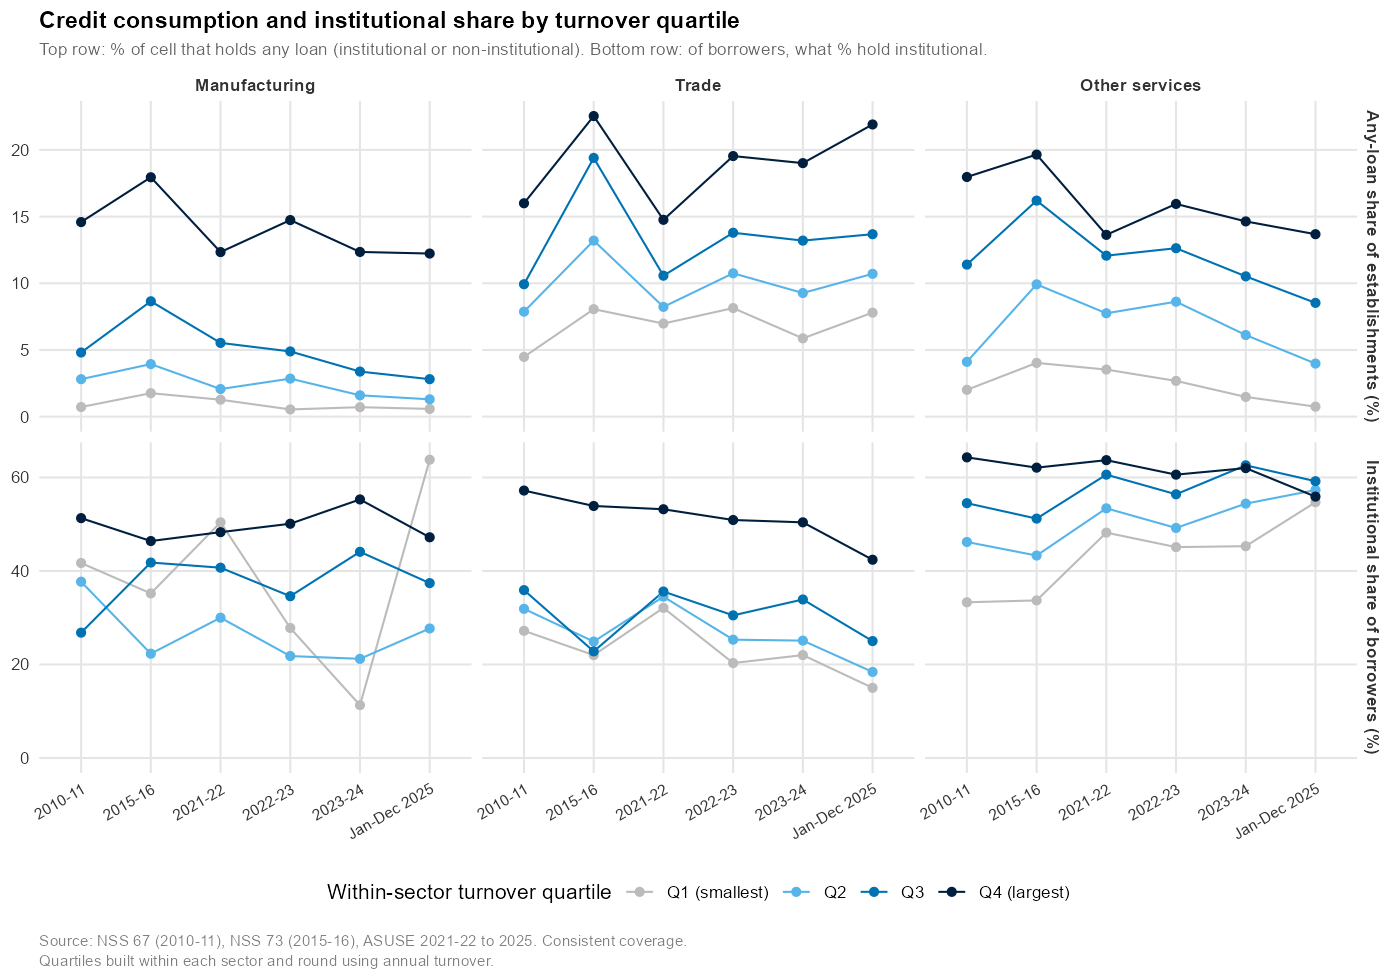
[Figure 3: Turnover quartiles and credit access, by sector and round]
Figure 3 confirms that this is the case. Enterprises with higher turnover are more likely to report outstanding credit across all three sectors. When it comes to institutional credit among those who do borrow, the picture is somewhat mixed across rounds, but the direction is consistent — turnover and institutional credit access are positively associated. A similar positive association holds for HWE status, whether the enterprise holds a bank account in its own name, and formalisation under various acts and registrations.
What the data cannot tell us is the direction of this relationship. Larger enterprises are more likely to have credit, but whether credit is what made them larger — or whether enterprises already growing faster are more likely to seek and obtain credit — is a question these cross-sectional data cannot resolve. Evidence from more carefully designed studies in developing-country settings tends to find that the causal effect of credit on enterprise growth is real but modest, and largely concentrated among enterprises already on a growth trajectory rather than those at the margin of viability. This is not a reason to dismiss credit access as a policy concern, but it does suggest caution about how much growth can be expected from credit expansion alone, particularly for the smallest enterprises.
Credit states
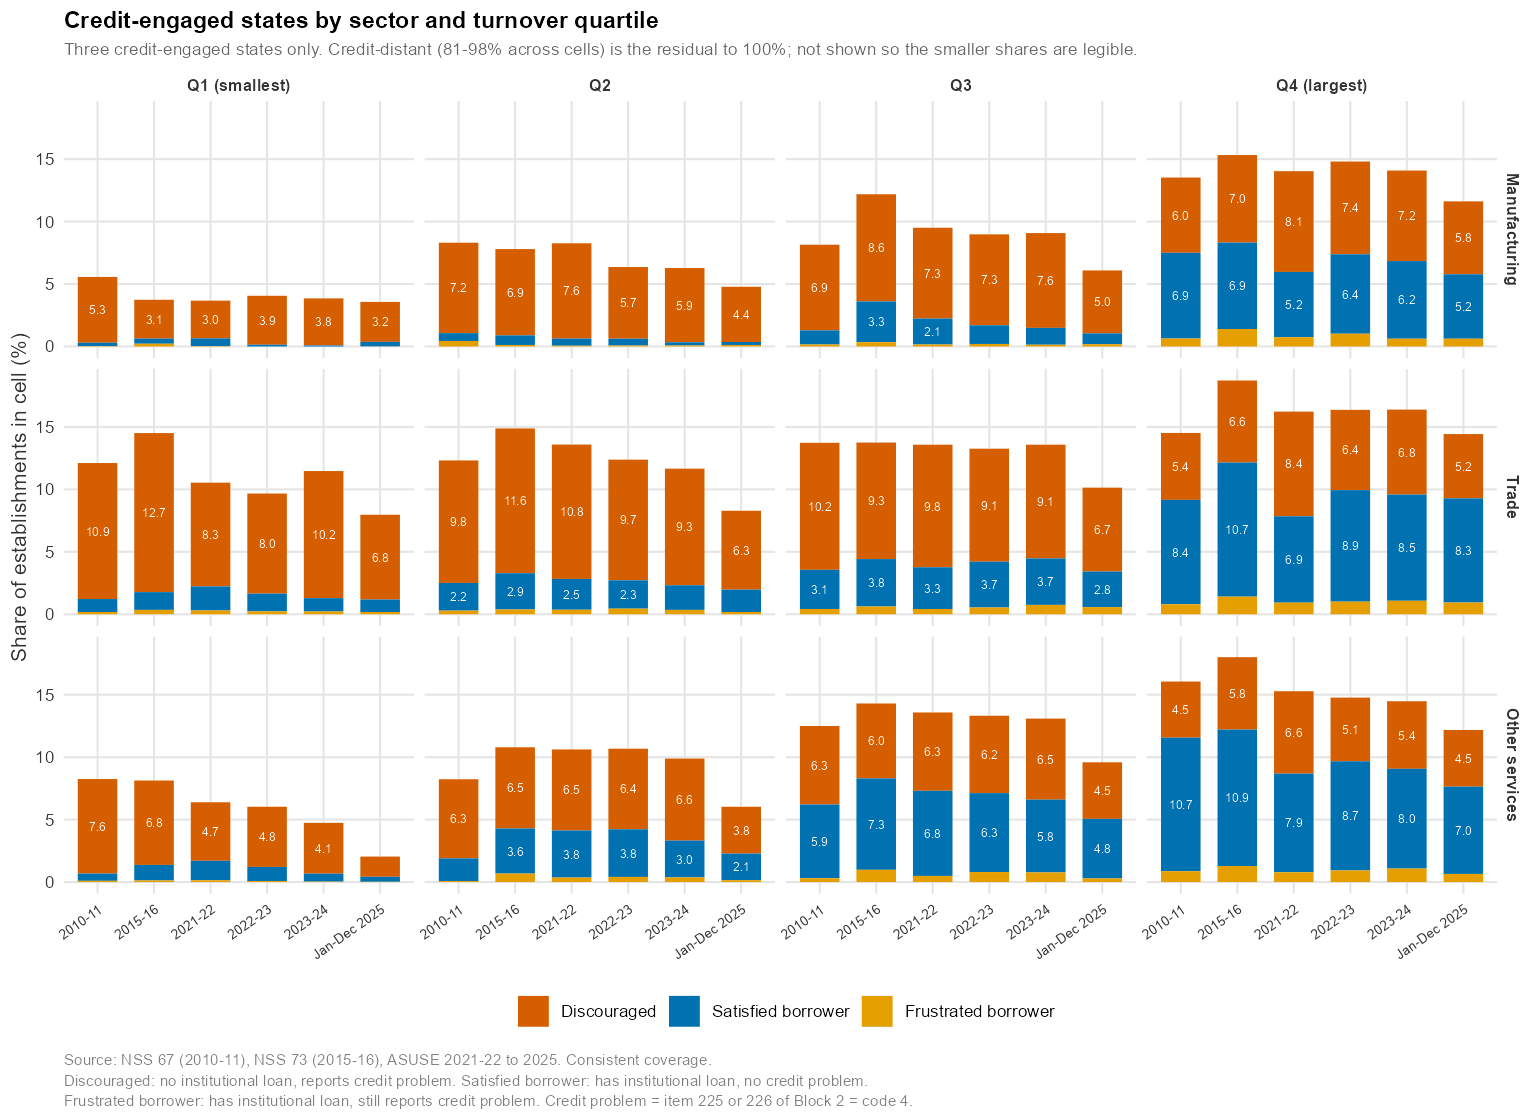
The low percentage of credit-reporting enterprises, combined with the positive association between credit access and enterprise scale, raises two possibilities: many enterprises may not be seeking credit based on their own assessment of their potential, or they may be unable to access it even when they want to. Across the six rounds, enterprises were asked about their two most pressing problems, and credit access is one possible response. We use this information to think of enterprises in four credit states: discouraged (no institutional loan but reports credit as a problem), satisfied (has an institutional loan and reports no credit problem), frustrated (has an institutional loan but still reports a credit problem), and distant (no institutional loan and reports no credit problem). Figure 4 shows this distribution by turnover quartile.
[Figure 4: Credit states by turnover quartile, sector, and round]
What Figure 4 does not show is the large share of credit-distant enterprises, and this share has grown in ASUSE 2025 across all sectors and turnover quartiles. This pattern is consistent with two different stories, and the data do not allow us to choose between them. One story is that a growing proportion of enterprises — predominantly OAEs running livelihood-type activities, as we discuss in the companion piece on the HWE-OAE distinction — correctly assess that formal credit is neither accessible nor particularly useful for their scale and nature of operation. On this reading, the growing credit-distant share is not a problem requiring intervention. The other story is that a growing segment has effectively stopped seeking formal credit, having learned through experience that it is not available to them. On that reading, some of what appears as self-exclusion is discouraged demand in a different form. The fact that discouraged borrowers — those who report credit as a problem but hold no institutional loan — are present across all turnover quartiles, including the top, suggests that some of the credit gap is supply-side rather than demand-side.
Satisfied borrowers — with institutional credit and no reported credit problem — rise as a share with turnover, consistent with better credit access for larger enterprises. Frustrated borrowers, those who hold institutional credit but still report it as a problem, form a small proportion and are more recognisable only in the upper turnover quartiles. The proportion of discouraged borrowers appears to have a weak negative association with turnover, suggesting that institutional credit access is more difficult for smaller enterprises. Notably, the proportion of discouraged borrowers declined in ASUSE 2025 relative to previous rounds, across sectors and quartiles — though, given the simultaneous rise in the credit-distant share, this likely reflects some movement from discouraged to distant rather than a genuine improvement in access.
Credit in the macro context
We conclude by looking at credit to unincorporated enterprises from a few macro reference points. Table 3 shows outstanding commercial bank credit to unincorporated enterprises compared with scope-matched RBI commercial bank credit (excluding agriculture, construction, infrastructure, lending to NBFCs, and SHG bank linkages), and MUDRA outstanding.
| Round | (a) Commercial bank credit to unincorporated enterprises (Rs lakh crore) | (b) Scope-matched RBI commercial bank credit (Rs lakh crore) | (a) ÷ (b), % | MUDRA / PMMY outstanding, end-March (Rs lakh crore) |
| NSS 67 (2010–11) | 0.43 | 16.87 | 2.52 | — (PMMY launched April 2015) |
| NSS 73 (2015–16) | 0.92 | 27.84 | 3.31 | 1.09 (PMMY’s first year) |
| ASUSE 2021–22 | 0.94 | 37.27 | 2.51 | 3.12 |
| ASUSE 2022–23 | 1.37 | 41.46 | 3.30 | 3.83 |
| ASUSE 2023–24 | 1.63 | 49.24 | 3.31 | 4.44 |
| ASUSE 2025 (Jan–Dec) | 1.45 | 55.59 | 2.61 | 4.50 |
Table 3: Commercial bank credit to unincorporated enterprises (ASUSE consistent master, commercial bank source only) compared with RBI sectoral deployment data matched by scope. MUDRA figures from PMMY administrative data. Source: ASUSE consistent masters; RBI Sectoral Deployment of Non-Food Bank Credit; PMMY Annual Reports.
Three numbers sit alongside each other in 2025: unincorporated enterprises account for 44 per cent of non-agricultural-non-construction employment, around 9 per cent of the corresponding gross value added, and roughly 2.6 per cent of scope-matched commercial bank credit. On a simple proportionality argument, the credit share looks low relative to both the employment and the GVA share. The sector appears underserved relative to its economic footprint.
That said, the adjustment from the 2015–16 peak is not entirely without explanation. From that peak, the employment share has fallen by 16 per cent, the GVA share has fallen by 26 per cent, and the commercial bank credit share has fallen by about 21 per cent. On this reading, the credit decline tracks the productivity decline, though it has adjusted somewhat less than GVA. Whether this implies that credit is appropriately contracting along with a relatively less productive sector, or that credit contraction is itself contributing to the productivity stagnation, is a question the data cannot resolve in either direction. ASUSE 2025 does show a sharper fall in the credit share than in the GVA share — and that gap, in a year where banking credit to the broader MSME sector was growing rapidly, deserves attention.
MUDRA has been a government scheme tailored specifically to unincorporated enterprises. Yet, as Table 3 shows, the outstanding credit from commercial banks reported by unincorporated enterprises in ASUSE has been roughly one-third of MUDRA outstanding credit in recent rounds. Part of this reflects the survey measurement characteristics described earlier: short-tenure loans repaid before the survey date are invisible; loans in the proprietor’s name rather than the establishment’s name may not be reported in Block 11. A MUDRA Shishu loan of Rs 30,000 over 12–18 months is likely to be repaid or nearly repaid by a survey reference date that falls partway through the year, and even if outstanding, may not be classified by the respondent as an establishment-purpose loan. The measurement gap is real and explainable. But it also raises a question worth examining: whether a credit instrument primarily designed as a short-tenure, individual-name loan is optimally structured for enterprise investment, as opposed to working capital or consumption smoothing. We do not have evidence to answer this definitively.
| Round | Commercial banks | Co-operative banks & societies | Government schemes | MFI / SHG | Term-lending institutions | Other institutional |
| NSS 67 (2010–11) | 68.2 | 13.6 | 7.4 | 3.0 | 2.8 | 5.0 |
| NSS 73 (2015–16) | 73.5 | 9.5 | 5.4 | 7.1 | 1.1 | 3.4 |
| ASUSE 2021–22 | 67.6 | 11.2 | 5.7 | 3.8 | 8.2 | 3.6 |
| ASUSE 2022–23 | 68.1 | 7.3 | 13.5 | 4.3 | 2.7 | 4.2 |
| ASUSE 2023–24 | 76.4 | 6.4 | 9.2 | 4.6 | 0.9 | 2.4 |
| ASUSE 2025 | 76.2 | 5.6 | 10.3 | 5.2 | 0.9 | 1.8 |
Table 4: Institutional sources as share of total outstanding institutional credit (%), consistent master. Source: author’s calculations from ASUSE consistent masters.
| Round | Commercial banks | Co-operative banks & societies | Government schemes | MFI / SHG | Term-lending institutions | Other institutional |
| NSS 67 (2010–11) | 51.5 | 22.5 | 7.1 | 12.3 | 1.3 | 7.5 |
| NSS 73 (2015–16) | 51.7 | 17.0 | 5.4 | 20.1 | 1.0 | 8.5 |
| ASUSE 2021–22 | 46.9 | 14.6 | 8.0 | 26.4 | 1.1 | 6.6 |
| ASUSE 2022–23 | 52.2 | 12.8 | 7.8 | 23.8 | 1.2 | 4.4 |
| ASUSE 2023–24 | 53.5 | 10.9 | 7.7 | 24.7 | 0.8 | 4.9 |
| ASUSE 2025 (Jan–Dec) | 59.5 | 8.3 | 7.9 | 21.8 | 0.8 | 4.1 |
Table 5: Institutional sources as share of borrowers with institutional credit (%), consistent master. Source: author’s calculations from ASUSE consistent masters.
As Tables 4 and 5 show, commercial banks continue to be the mainstay of institutional credit to unincorporated enterprises, with their position more entrenched over the years — unsurprisingly, since they can lend larger amounts at lower rates than other institutional sources. Government schemes have played a broadly steady role in both credit amount and borrower share.
The retreat of cooperative banks is worth flagging separately. Their share of both institutional credit outstanding and institutional borrowers has fallen across every round, from 22.5 per cent of borrowers in 2010–11 to 8.3 per cent in 2025. Cooperative banks have historically been closer to unincorporated enterprises — geographically and in their lending practices — than commercial banks. Their retreat, whether driven by regulatory constraints or balance sheet difficulties, is being partially filled by MFIs and NBFCs, which typically lend at higher rates, and increasingly by commercial banks, which rely more heavily on credit bureau history and digital footprint for scoring. To the extent that unincorporated enterprises — particularly smaller ones without established credit histories — have depended on relationship-based lending from cooperatives, their retreat may be one structural factor behind the declining penetration trend. The role of MFIs in both credit amount and borrower share appears to have contracted somewhat in 2025, possibly reflecting the tightening of regulations on NBFC-MFI lending in recent years.
Conclusion
Three observations emerge from reading these six rounds of data together.
The first is that the headline — 80 per cent of outstanding credit from institutional sources — describes the composition of a small and, over time, shrinking borrower pool. The share of enterprises with any outstanding credit was 12.2 per cent in 2015–16 and has declined to 8.1 per cent in 2025. In absolute terms, the number of enterprises with institutional loans fell over this period even as the enterprise universe grew by 1.4 crore. The 80 per cent figure is not wrong, but it measures the lending channel preference among a declining minority of borrowing enterprises, not whether credit is reaching the sector broadly.
The second observation is about who holds what credit. Enterprises with higher turnover, with hired workers, with formal bank accounts in the establishment’s name, and with statutory registrations are consistently more likely to access institutional credit — and this pattern has been stable across all six rounds. The data do not allow us to determine whether credit access explains the higher productivity of these enterprises, or whether enterprises already on a growth trajectory find credit more readily. Studies from other contexts tend to find modest and heterogeneous causal effects of credit on enterprise growth, concentrated among enterprises that are already growing. If that finding holds for this population, then expanding the institutional credit share among borrowers — the goal implicit in much policy discussion — may do less than is sometimes assumed, particularly for enterprises where credit is not the binding constraint.
The third observation concerns cooperative banks. Their steady retreat across six rounds — from nearly a quarter of institutional borrowers to fewer than one in twelve — is the most significant structural change in the credit landscape for unincorporated enterprises visible in these data. Cooperative banks have historically provided relationship-based, proximity-based credit to this segment. The space they are vacating is being filled by institutions that rely more heavily on formal credit history and digital infrastructure, which many unincorporated enterprises — particularly smaller ones — do not have. If this structural shift continues, the penetration trends visible in this data are likely to persist regardless of how much MSME credit the banking system extends in aggregate.
Credit is not the only constraint on the growth of unincorporated enterprises, and possibly not the primary one for most of them. But for the segment that does need it — hired-worker enterprises with capital investment plans and market-backed growth trajectories — the evidence suggests that the terms, tenure, and institutional channels of available credit may be poorly matched with what investment-driven growth requires. That is a more precise problem statement than ‘credit access needs to improve’, and it points toward different levers.
Explore More Research on India’s Enterprise Economy
Want to understand how the HWE-OAE distinction impacts economic productivity? Check out our companion piece in the Blog Section to discover the structural shifts transforming India’s informal economy