A Data-Driven Guide to Instagram Analytics: How to Measure What Matters
Instagram analytics unlock the real drivers of success on a platform where millions engage daily. In 2026, with Instagram analytics showing unified views as the core measure across posts, Reels, and Stories, businesses gain precise clarity on what content truly resonates. Industry leaders use Instagram analytics to cut through noise, identify high-impact posts, and adjust tactics for stronger results.
This guide explains practical ways to track and apply data, drawing from proven approaches in the deAsra and dreamBIG podcast series. For tailored strategies on using Instagram effectively, check this resource from deAsra: Unlock Instagram’s Power for Your Small Business. Master Instagram analytics to turn observations into strategic wins.

Why Instagram Analytics Matter in 2026
Instagram analytics reveal audience preferences and content performance with unmatched detail. Businesses that review these numbers consistently spot winning patterns early—such as Reels driving wider distribution or carousels earning more saves. Ignoring Instagram analytics leads to repeated efforts on low-value posts, while regular checks guide smarter choices.
The platform’s shift to views as the primary metric simplifies comparisons across formats. Instagram analytics help leaders align social activity with business objectives, whether building awareness or generating leads. In a competitive space, data separates guesswork from growth.
How to Access Instagram Analytics
How to see your Instagram analytics begins with a professional account setup. Convert to a business or creator profile in settings to activate the full dashboard—no extra cost applies.
From the app, navigate to your profile and tap Professional dashboard. This opens an overview of the past 30 days, covering views, interactions, new followers, and shared content. Switch to instagram.com for a desktop view by selecting Dashboard from the menu, then Insights below Professional dashboard.
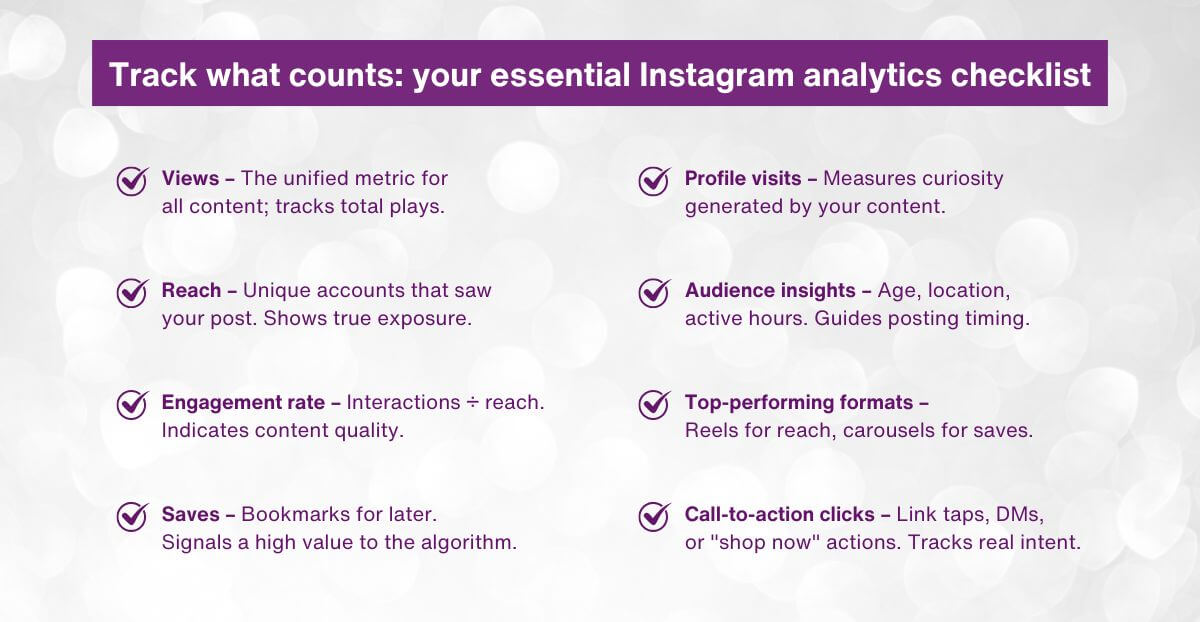
How to see your Instagram analytics for specific items works simply. Tap View insights under any post or Reel, or swipe up on Stories. These screens display tailored metrics like accounts reached and interactions.
Understanding the Instagram Analytics Report
The Instagram analytics report organises data into clear sections for quick review. Account insights provide overall trends in views, interactions, and follower changes. Content insights break down performance by type—posts, Reels, Stories—with filters for time periods up to 90 days.
Many leaders export or screenshot the Instagram analytics report for team discussions. Weekly reviews catch shifts fast, while monthly summaries highlight longer trends. Consistent use of the Instagram analytics report builds a reliable picture of progress.
Key Metrics to Track
1. Reach and Its Role
Reach counts unique accounts that view your content. This metric shows true exposure beyond followers, reflecting algorithm favour when content performs well. Higher reach means broader visibility—track it to measure discovery success.
2. Impressions and Views
Impressions represent total displays, including repeats to the same user. In 2026, views serve as the unified standard for plays across formats, replacing older distinctions. Compare views with reach to see frequency of exposure and build familiarity.
3. Engagement Rate Explained
Engagement rate divides interactions—likes, comments, shares, saves—by reach or followers, shown as a percentage. This figure indicates content strength in sparking responses. Strong rates boost algorithmic promotion and signal audience connection.
4. Saves as a Priority Signal
Saves mark content with lasting value, as users bookmark for later. High saves tell the algorithm the post deserves a wider push. Focus on saves for educational or practical content—Reels and carousels often excel here.
Mr. Bhaskar Thakur shares practical advice on early tracking: “In the first 30 days, focus on how people interact with your content. Identify your ‘champions’—those engaging with your posts—and learn which posts work best.”
He adds on progression: “The third stage is about call-to-action performance—like ‘DM for a quote’ or ‘Visit our website.’ Measure how many people click links or send messages, as this shows intent to transact.”
These insights stress moving from basic views to meaningful actions through Instagram analytics.
Applying Insights to Refine Your Strategy
Instagram analytics guide direct improvements. If Reels show strong reach but fewer saves, experiment with stronger hooks or added value in the opening seconds. When carousels lift engagement rate, produce more of them.
Audience data in Instagram analytics—top locations, age groups, active times—helps tailor timing and topics. Mumbai-based users might respond best to local references posted during peak IST hours.
Boost high-performers based on the Instagram analytics report. Modest spending on Reels with proven engagement often yields strong returns. For Reels-specific tactics in 2026, explore this detailed guide: Instagram Reels Marketing: The Ultimate Guide to Going Viral in 2026.
Common Pitfalls and Best Practices
Avoid vanity focus—likes impress, but saves and shares drive distribution. Check how to see your Instagram analytics weekly to stay responsive. Set simple benchmarks, such as a target engagement rate or growth in reach, and then adjust them based on the data.
deAsra supports and engages businesses through the dreamBIG podcast series, delivering real-world tips on using Instagram analytics effectively.
Conclusion
Instagram analytics equip leaders with the tools to measure what drives real impact. By focusing on reach, views, engagement rate, and saves, you gain control over platform performance. The Instagram analytics report acts as a steady guide for refinements that compound over time.
Commit to regular dashboard visits, act on clear trends, and let data steer decisions. Instagram analytics convert effort into measurable, lasting growth—start reviewing yours today.

FAQs
1. What is the best way to start using Instagram analytics?
Switch to a business or creator account in settings to unlock the Professional dashboard. This provides instant access to Instagram analytics covering the last 30 days, including views and interactions. Review the overview first, then explore content-specific insights to build familiarity.
2. Which metric in Instagram analytics matters most for growth?
Engagement rate stands out, as it measures likes, comments, shares, and saves against reach. Strong rates encourage the algorithm to distribute content further, fuelling follower increases and visibility in a positive cycle.
3. How often should I check the Instagram analytics report?
Aim for weekly reviews of Instagram analytics to identify emerging patterns while the data remains relevant. Monthly summaries reveal broader trends in reach and engagement rate, enabling timely tweaks after new content tests.
4. Can Instagram analytics show why a post underperforms?
Yes—compare metrics in content insights. Low reach may stem from timing or weak openings, while few saves indicate limited ongoing value. Use these observations from Instagram analytics to strengthen captions, visuals, or calls-to-action next time.
5. How do saves in Instagram analytics influence strategy?
Saves highlight content with enduring appeal, a key algorithmic boost. Emphasise formats like carousels or tip-based Reels that earn high saves. Monitor this in Instagram analytics to prioritise evergreen topics that encourage bookmarks and improve long-term reach.