Two Sectors, One Label: What six rounds of enterprise survey data reveal about India’s unincorporated economy
Data note: This analysis draws on six rounds of enterprise survey data spanning 2010–11 to 2025: the NSS Unincorporated Enterprise Surveys (67th round, 2010–11; 73rd round, 2015–16) and four rounds of the Annual Survey of Unincorporated Sector Enterprises (ASUSE: 2021–22, 2022–23, 2023–24, 2025). Figures are drawn from consistent cross-round subsets constructed to ensure comparability and may differ from officially published round-level estimates.
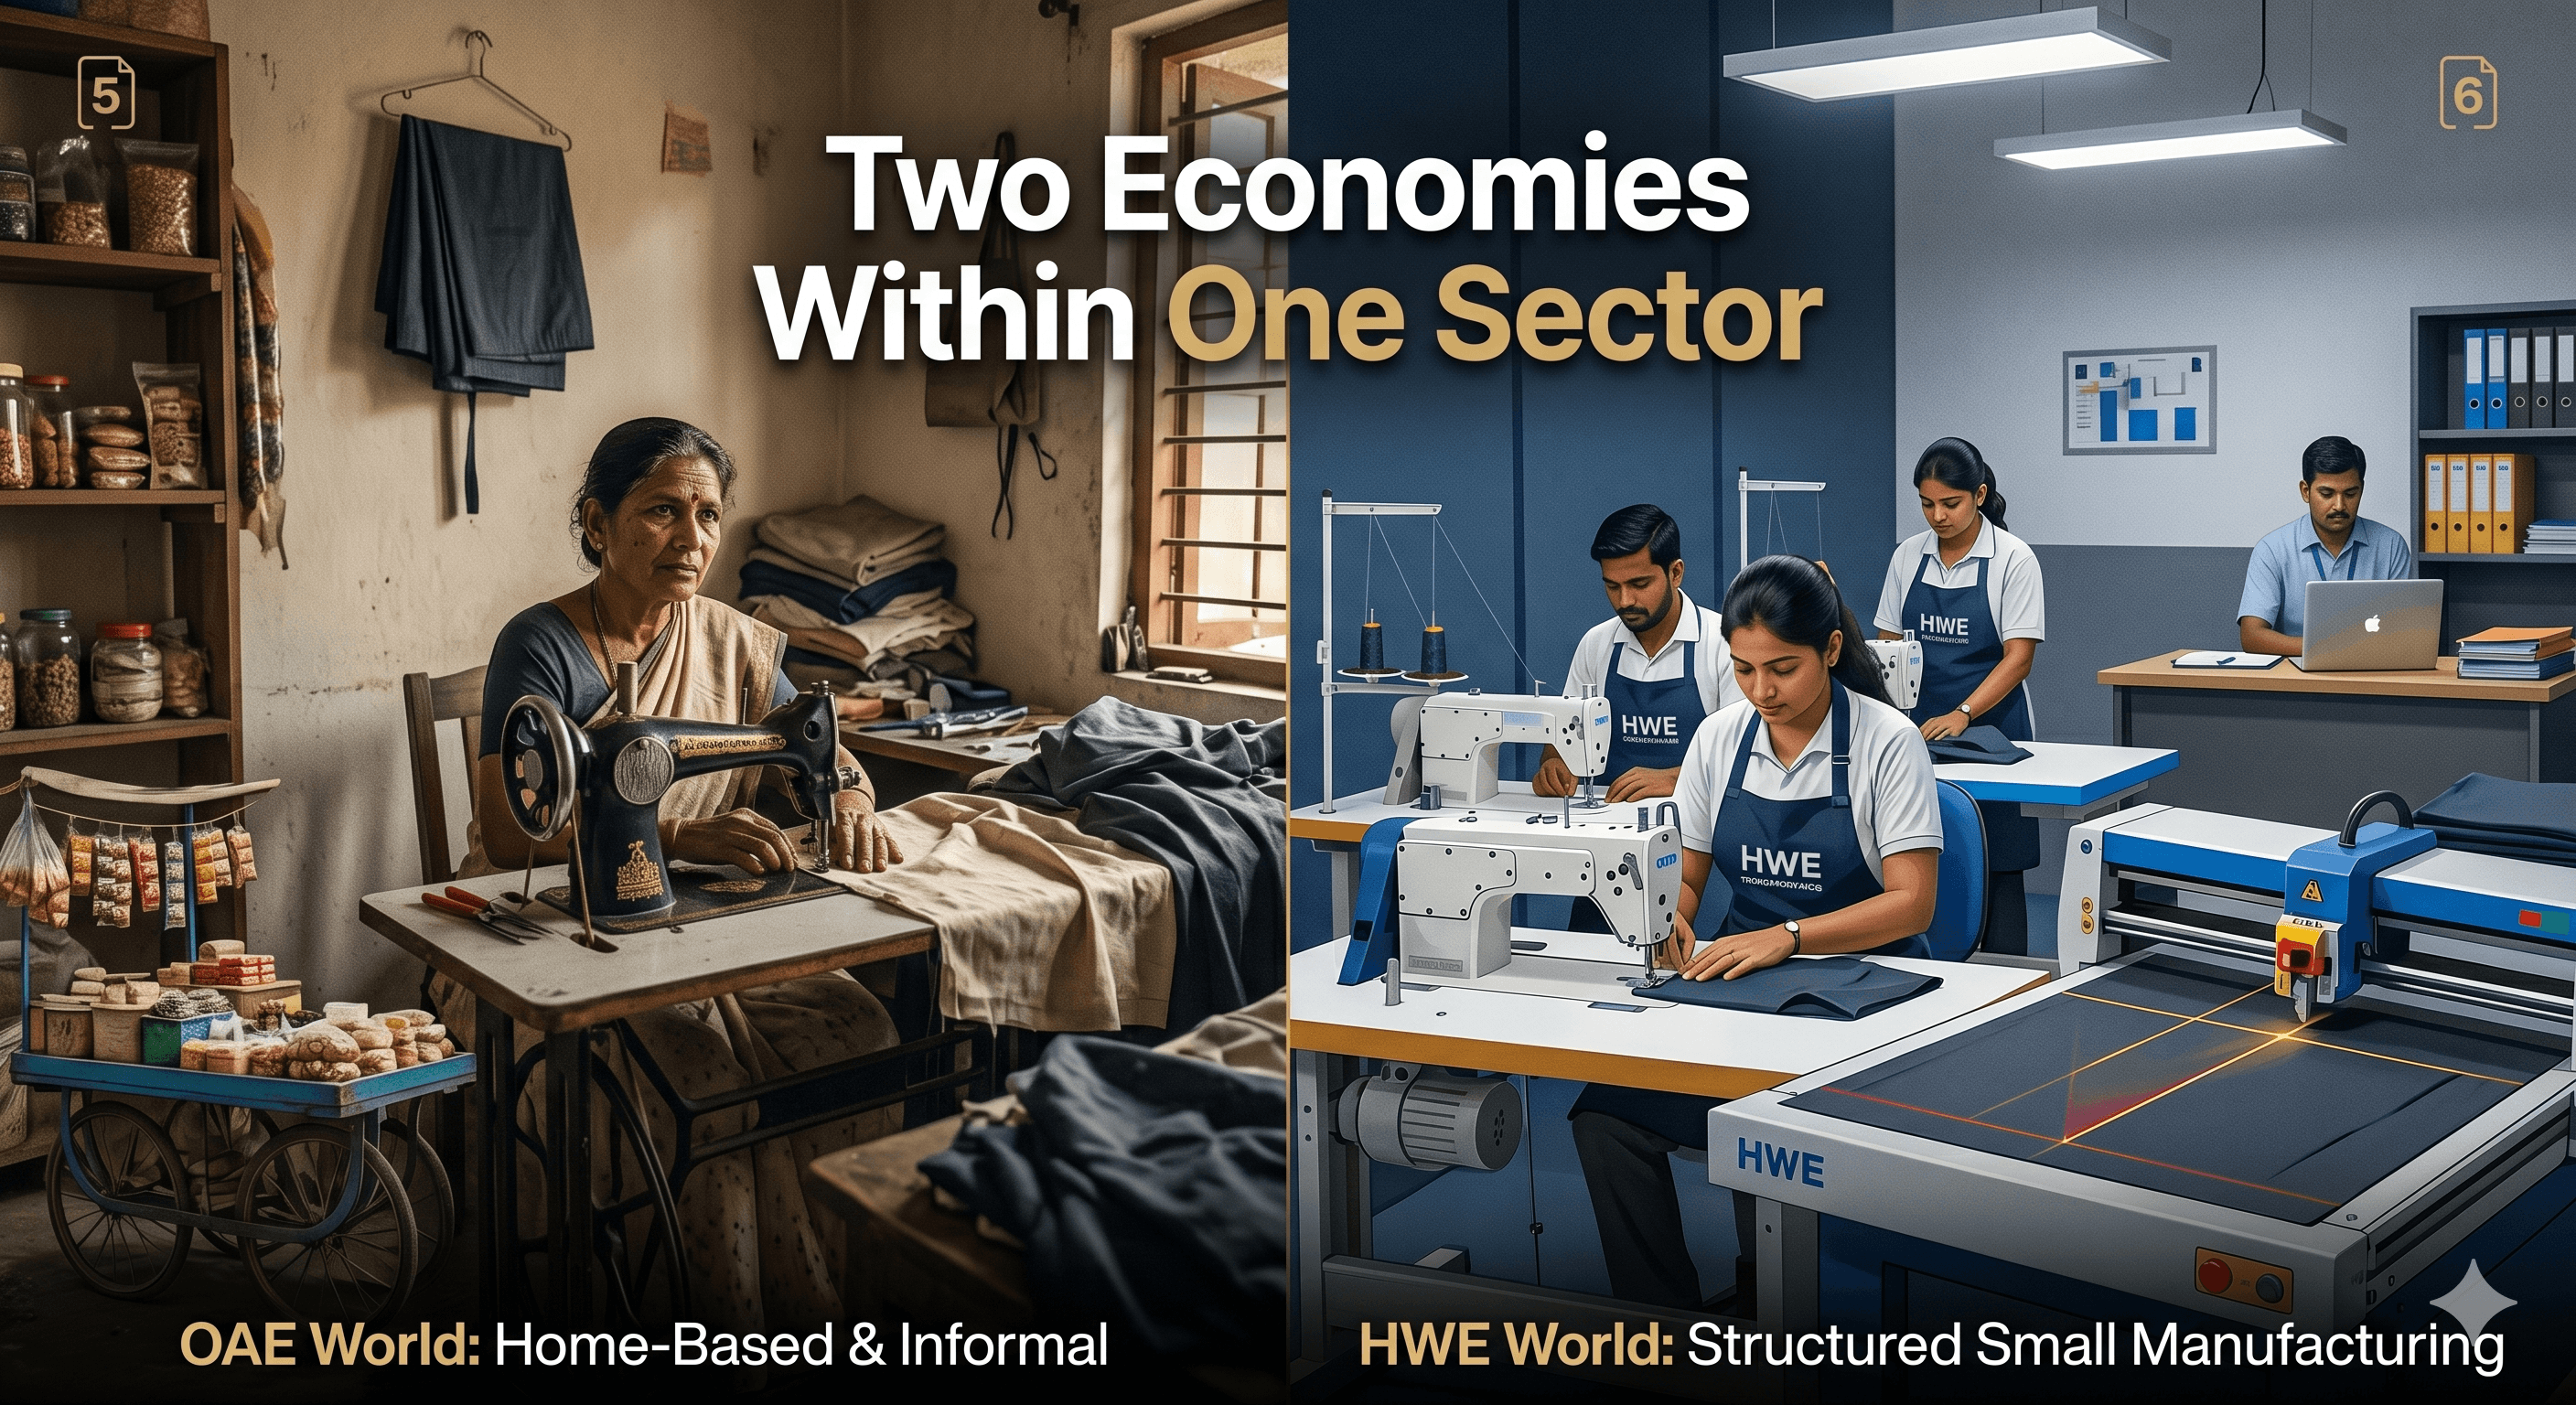
India’s non-agricultural unincorporated enterprises employ a large share of the country’s non-agricultural workforce. They are routinely referred to as the “informal sector.” Six rounds of enterprise survey data, spanning fifteen years, offer enough evidence to examine what is actually going on inside this sector — how it fits into the broader economy, how enterprise-level outcomes have evolved, and whether the informal-sector label is doing useful analytical work.
Two findings organise this piece. First, the sector accounts for a disproportionately large share of employment relative to its contribution to value added, and that gap has widened. Second, the sector contains two structurally different populations — hired-worker enterprises and own-account enterprises — whose differences are not of degree but of kind.
1. The unincorporated sector in the broader economy
Table 1 summarises the sector’s size and composition across six rounds. Total enterprise counts grew from 5.5 crore in 2010–11 to 7.6 crore in 2025, with a sharp Covid dip in 2021–22. The share of enterprises employing at least one hired worker — hired-worker enterprises, or HWEs — has fallen from 15.4 per cent to 13.0 per cent over this period. The sector’s growth has come almost entirely from own-account enterprises.
| Round | Total enterprises (cr) | Total workers (cr) | HWEs (cr) | OAEs (cr) | HWE share (%) | GVA share (%)* | Employment share (%)* |
| 2010–11 | 5.54 | 10.06 | 0.85 | 4.68 | 15.4 | 10.8 | 56.0 |
| 2015–16 | 6.12 | 10.91 | 0.96 | 5.15 | 15.7 | 12.3 | 52.7 |
| 2021–22 | 5.65 | 9.40 | 0.79 | 4.85 | 14.0 | 8.5 | 37.8 |
| 2022–23 | 6.06 | 10.58 | 0.91 | 5.15 | 15.0 | 8.5 | 40.7 |
| 2023–24 | 6.67 | 11.49 | 0.94 | 5.73 | 14.1 | 8.9 | 43.3 |
| 2025 | 7.59 | 12.56 | 0.99 | 6.60 | 13.0 | 9.1 | 44.4 |
Table 1: Six-round summary, non-agricultural unincorporated enterprises (Manufacturing, Trade, Services combined). *GVA and employment shares relative to the non-agricultural non-construction economy. Sources: Survey data as in data note; MoSPI NAS; India KLEMS (2024 release).
The last two columns show the structural problem. In 2010–11, the sector accounted for 11 per cent of non-agricultural-non-construction GVA while employing 56 per cent of the corresponding workforce — a five-to-one ratio. By 2025, the GVA share has fallen to 9 per cent and the employment share to 44 per cent; the ratio remains five to one. The GVA share decline is not alarming in itself — it is what formalisation looks like in aggregate. What matters is that the employment share has not declined proportionally. The sector is absorbing a large fraction of the non-agricultural workforce at productivity levels that are declining relative to the rest of the economy.
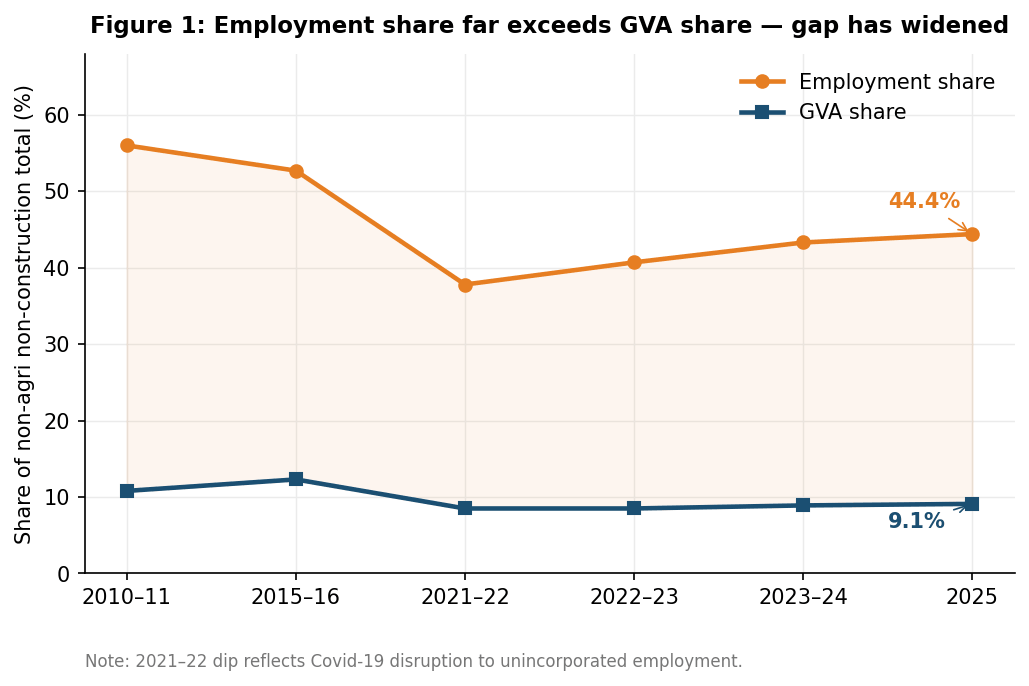
Figure 1: Share of non-agricultural unincorporated enterprises in non-agricultural non-construction GVA and employment, six rounds. Sources: Survey data; MoSPI NAS; India KLEMS (2024).
2. How the sector has fared: surplus and emoluments across six rounds
Figure 2 disaggregates enterprise-level performance by type. The left panel shows real surplus per HWE — what remains for the entrepreneur after paying hired workers. The right panel shows real GVA per OAE — essentially the owner’s net earnings, since OAEs pay no hired wages. Both are in 2024 prices.
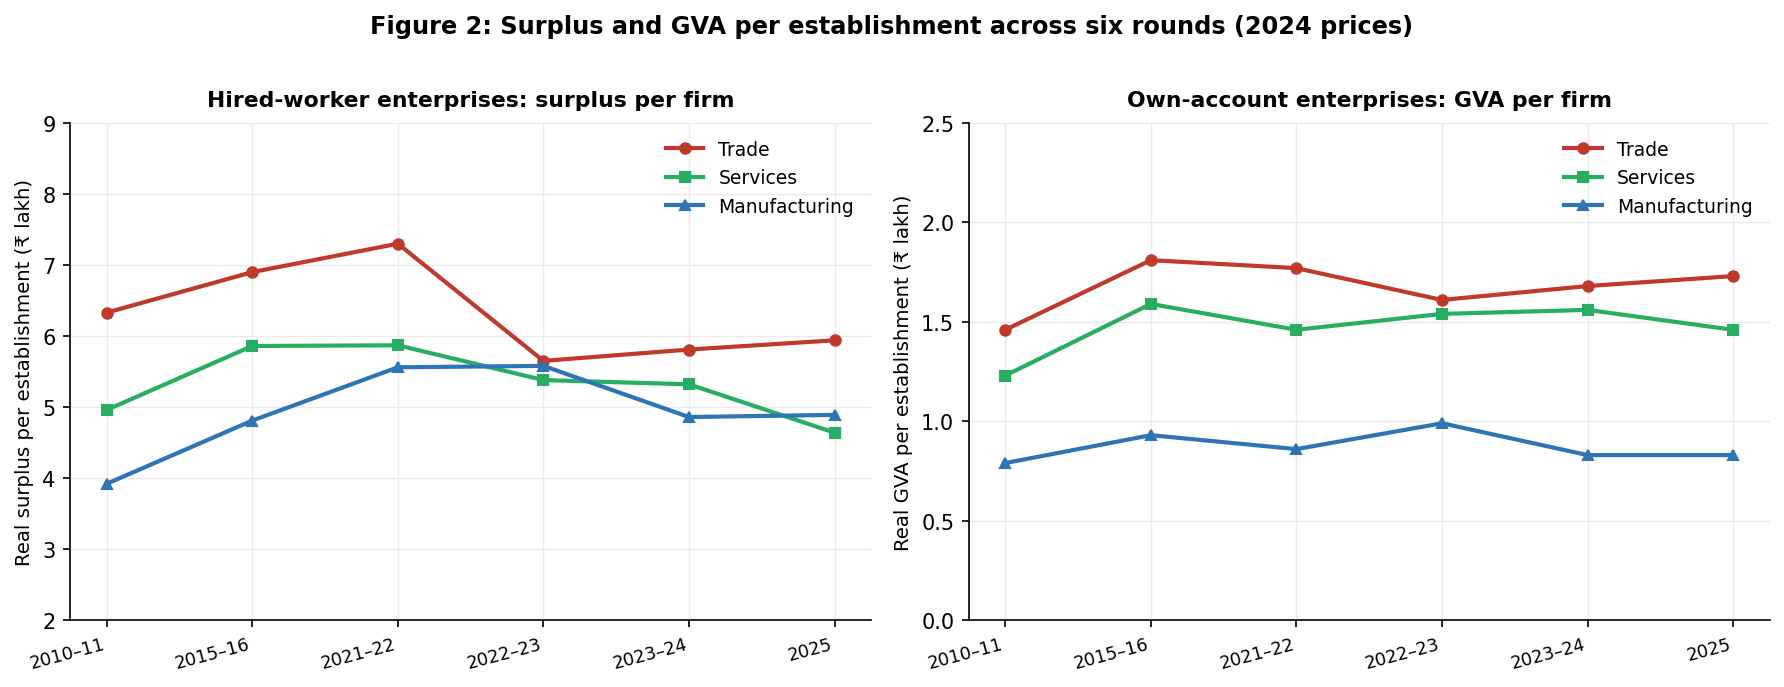
Figure 2: Real surplus per HWE establishment (left) and real GVA per OAE establishment (right), by sector, six rounds (2024 prices). Source: author’s calculations from survey data.
The OAE panel shows a broadly flat story. Real GVA per establishment has oscillated within a narrow band in all three sectors across fifteen years — between ₹0.79 and ₹0.99 lakh in manufacturing, ₹1.46 and ₹1.81 lakh in trade, ₹1.23 and ₹1.59 lakh in services. There is no sustained upward trend. Fifteen years of OAE count growth have produced no measurable productivity improvement at the level of the individual establishment.
The HWE panel tells a different story. Real surplus per HWE rose across all three sectors from 2010–11 through a peak around 2021–22, then fell. In trade, surplus peaked at ₹7.3 lakh before falling to ₹5.9 lakh by 2025 — roughly the 2010–11 level. In services, the decline from peak is 21 per cent. In manufacturing, the 2025 figure has erased about half the gains made over the previous decade. The squeeze is driven not by falling turnover but by a rising wage share of GVA: hired workers are absorbing a growing fraction of enterprise value added, leaving a shrinking surplus for the entrepreneur.
Figure 3 shows what hired workers in these enterprises earn in real terms.
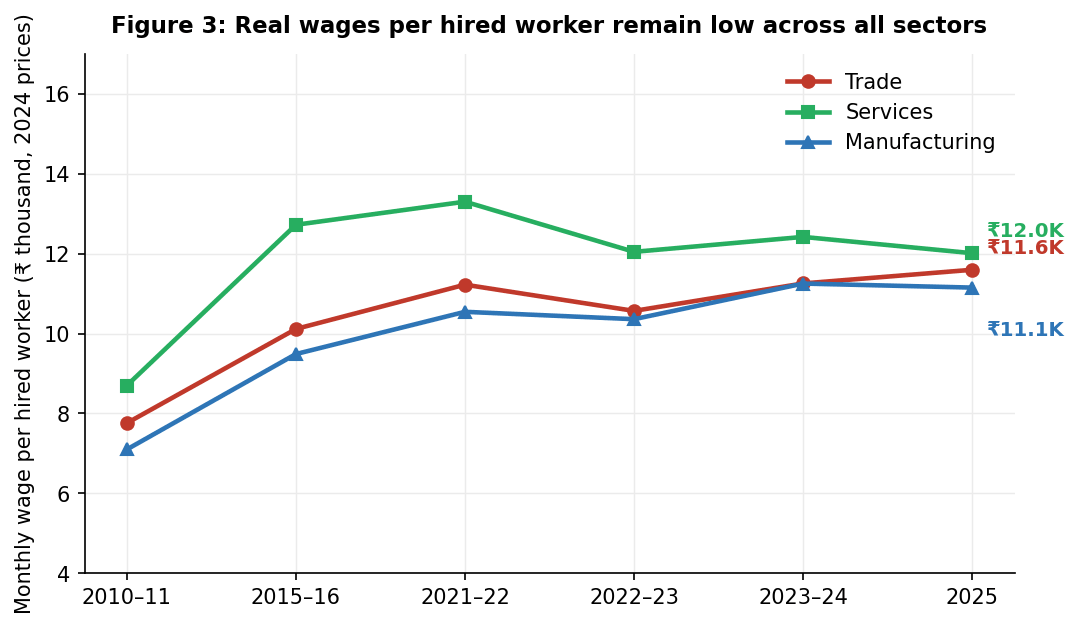
Figure 3: Real monthly wage per hired worker in unincorporated HWEs, by sector, six rounds (2024 prices). Source: author’s calculations from survey data.
Wages are low and have improved only modestly in real terms since 2010–11. By 2025, services HWE workers earn ₹12,009 per month; trade workers ₹11,595; manufacturing workers ₹11,149. In all three sectors, real wages peaked around 2021–22 and have since stagnated or edged back. The sector’s hired workers — those in the more productive, employing tier — are not seeing sustained real wage growth.
3. The HWE–OAE dichotomy
Table 2 places the two populations side by side as of 2025. The differences are large and consistent across sectors.
| Indicator | Mfg HWE | Mfg OAE | Trade HWE | Trade OAE | Svc HWE | Svc OAE |
| Scale and output | ||||||
| Establishments (lakh) | 23.6 | 190.8 | 34.8 | 193.9 | 38.2 | 273.7 |
| Workers per establishment | 5.1 | 1.2 | 3.5 | 1.4 | 4.9 | 1.1 |
| Real turnover per firm (₹ lakh) | 32.3 | 1.9 | 87.7 | 11.8 | 19.3 | 2.7 |
| Real GVA per firm (₹ lakh) | 9.9 | 0.8 | 8.9 | 1.7 | 10.0 | 1.5 |
| Real surplus / GVA per firm (₹ lakh) | 4.9 | 0.8 | 5.9 | 1.7 | 4.6 | 1.5 |
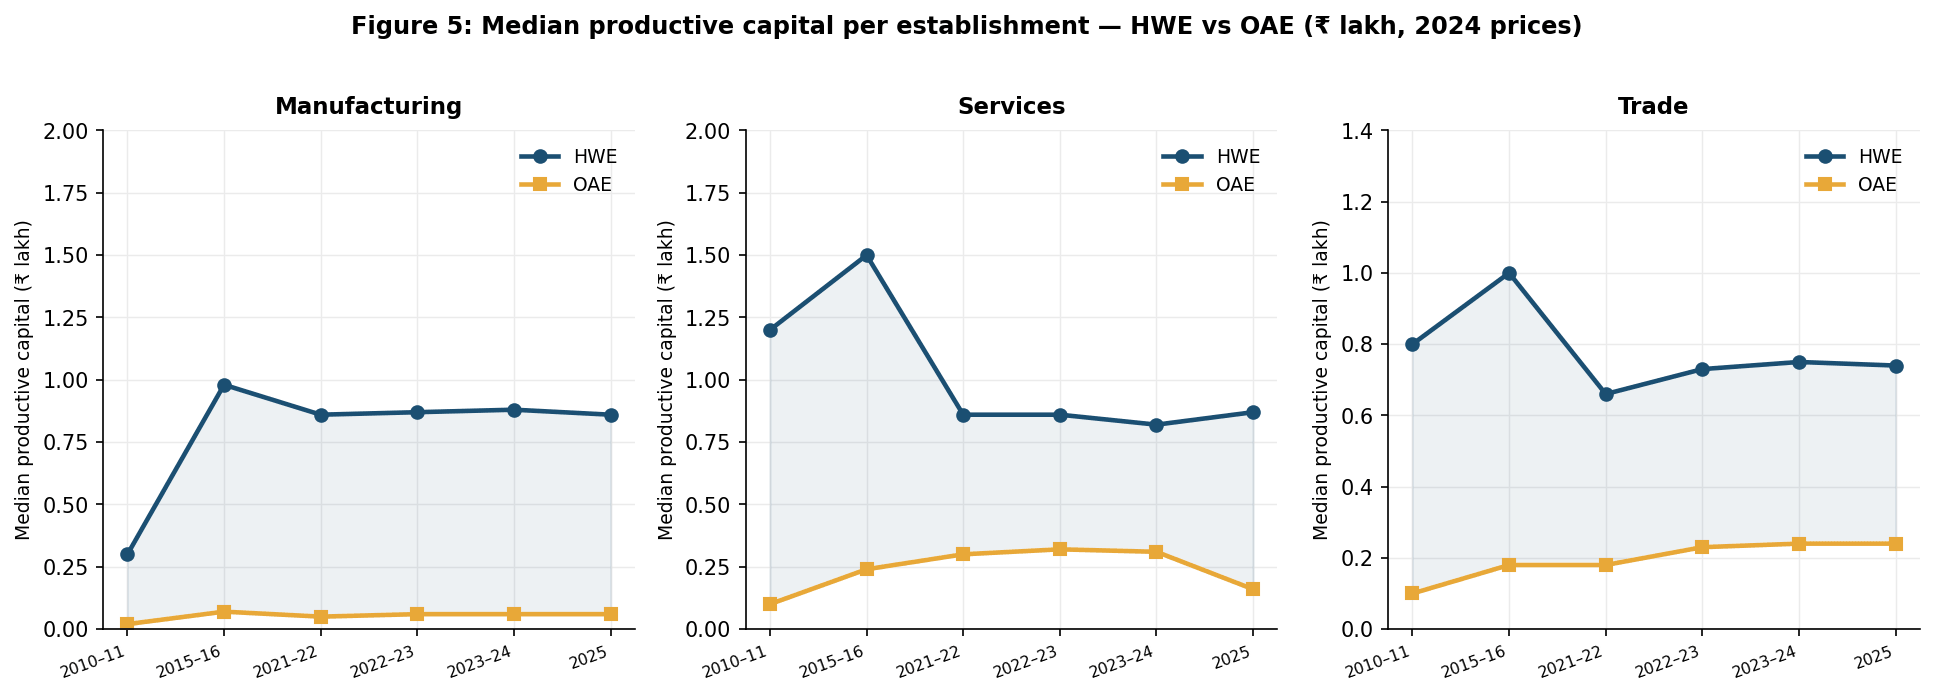
| Capital — median per establishment (₹ lakh, 2024 prices) | ||||||
| Total fixed assets | 4.10 | 1.41 | 3.66 | 1.53 | 4.32 | 2.25 |
| Productive capital† | 0.86 | 0.06 | 0.74 | 0.24 | 0.87 | 0.16 |
| Formalisation | ||||||
| Workers in registered enterprises (%) | 76.3 | 12.4 | 83.4 | 36.5 | 82.8 | 38.1 |
Table 2: HWE vs OAE comparison, 2025. Real values in 2024 prices. †Productive capital = plant & machinery + transport equipment + tools + software; excludes land and buildings. ‘Registered’ = any statutory body (Shops & Estab. Act, Udyam, GST, or other). Source: ASUSE 2025; author’s calculations.
Every dimension of the comparison points in the same direction. A manufacturing HWE has a real turnover of ₹32 lakh with 5 workers; a manufacturing OAE has ₹2 lakh with 1.2 workers. In services, ₹19 lakh versus ₹3 lakh. In trade, ₹88 lakh versus ₹12 lakh — though trade is intrinsically low in productive capital requirements for both types, and the better indicator of the divide there is the scale gap rather than the capital gap.
In manufacturing and services, the productive capital data makes the dichotomy most precise. The median manufacturing HWE holds ₹86,000 of productive capital — plant, machinery, tools, transport equipment — against ₹6,000 for the median manufacturing OAE: a 14-fold gap that has been stable across all six rounds with no sign of convergence. Even the top 5 per cent of manufacturing OAEs hold only ₹78,000 of productive capital — barely reaching the median HWE. In services, the median productive capital gap is around 5-fold.
The gap is not closing from below — it is widening. Each year, the average manufacturing OAE adds approximately ₹4,200 of real fixed capital; the average manufacturing HWE adds ₹54,600. Table 3 sets out the arithmetic across sectors.
| Sector | OAE: annual capital addition | HWE: annual capital addition | Gap widening per year | Years for OAE to reach current HWE stock* |
| Manufacturing | ₹4,200 | ₹54,600 | +₹50,400 | ~113 years |
| Trade | ₹8,000 | ₹35,800 | +₹27,800 | ~74 years |
| Services | ₹14,900 | ₹75,400 | +₹60,500 | ~62 years |
Table 3: Capital formation rates and implied convergence timeline, 2025. Annual capital addition = mean net addition to fixed assets (NAFA) per establishment, real 2024 prices. *Assumes HWE capital stock frozen at 2025 level — a conservative assumption since HWE NAFA exceeds OAE NAFA. Source: ASUSE 2025; author’s calculations.
Whatever narrowing has occurred in the mean capital gap between 2010–11 and 2025 is not the result of OAE accumulation. OAE mean capital has been essentially flat in real terms in manufacturing and trade across all six rounds. The narrowing is driven almost entirely by HWE mean capital falling — down 29 per cent in real terms in manufacturing and 28 per cent in trade since 2010–11. Some of this reflects a composition effect: smaller HWEs entered the count after Covid, while some larger, established HWEs may have graduated into the registered manufacturing frame. Either way, it is a downward-from-HWE story, not an upward-from-OAE one.
On registration, the contrast is equally sharp. Among HWEs, 76–83 per cent of workers are in enterprises registered with at least one statutory body, and this share has been rising. Among OAEs, the figure is 12 per cent in manufacturing and 36–38 per cent in trade and services. The informal-sector label, applied to the unincorporated sector as a whole, accurately describes the OAE majority but badly mischaracterises the HWE minority.
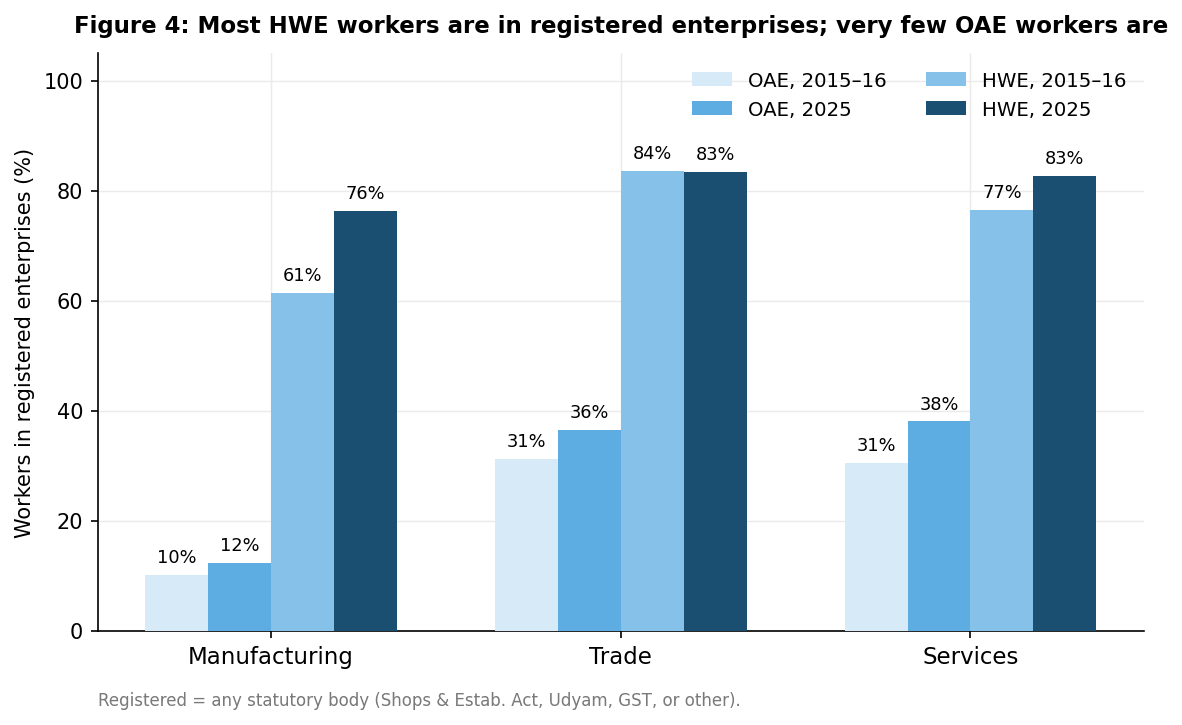
Figure 4: Share of workers in registered enterprises, by enterprise type and sector, 2015–16 and 2025. Sources: NSS 73rd Round; ASUSE 2025.
A natural question is whether OAEs graduate into HWEs over time. The data do not support this as a general pattern. The HWE share of total enterprises has fallen from 15.7 per cent in 2015–16 to 13.0 per cent in 2025, even as the total enterprise count grew by over 1.4 crore. A 14-fold gap in productive capital, stable for fifteen years in manufacturing, is not a gap that closes through gradual accumulation — the capital formation arithmetic makes that clear.
A more plausible interpretation is that HWEs and OAEs are different at the point of inception, not different stages of the same journey. An enterprise that starts by hiring labour typically does so because its founder has secured a market, assembled capital, or has the managerial capacity to run a multi-person operation from the outset. An OAE is typically a livelihood arrangement — a household deploying its own labour in the absence of better alternatives. The data cannot confirm this directly, but the stable turnover and capital ratios across fifteen years are consistent with it. The relevant policy question is therefore not how to help OAEs graduate into HWEs — though some will — but what conditions support the formation and survival of HWE-type enterprises, and why the incentive to hire appears to be weakening.
That the unincorporated sector’s GVA share is falling is not alarming — it is formalisation working as expected. What is concerning is that the employment share is falling more slowly, leaving a growing number of workers in OAE-type arrangements with stagnant productivity and low earnings. The HWE tier — the part of the sector that actually generates employment and surplus — is both shrinking as a share of enterprises and seeing its per-establishment surplus erode. These two trends together explain the widening employment-value mismatch documented in Section 1. Addressing it requires engaging with the HWE and OAE populations on their own terms, not as a single undifferentiated informal sector.
Explore More Research on India’s Enterprise Economy
Discover more analysis, research notes, and insights on informal enterprises, livelihoods, credit access, and economic transformation in India.